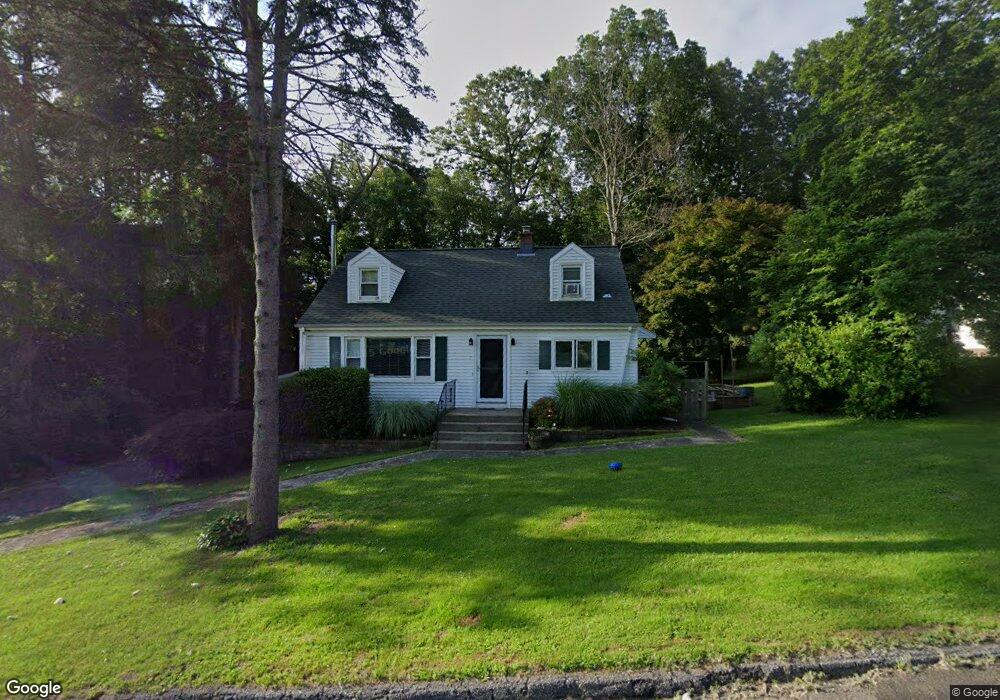
7 Olson Dr Seymour, CT 06483
Estimated Value: $330,272 - $440,000
3
Beds
1
Bath
1,333
Sq Ft
$271/Sq Ft
Est. Value
About This Home
This home is located at 7 Olson Dr, Seymour, CT 06483 and is currently estimated at $361,318, approximately $271 per square foot. 7 Olson Dr is a home located in New Haven County with nearby schools including Bungay Elementary School, Seymour Middle School, and Seymour High School.
Ownership History
Date
Name
Owned For
Owner Type
Purchase Details
Closed on
Mar 29, 1996
Sold by
Bilodeau Andrew and Bilodeau Michele
Bought by
Stoll Anthony E and Stoll Barbara A
Current Estimated Value
Home Financials for this Owner
Home Financials are based on the most recent Mortgage that was taken out on this home.
Original Mortgage
$136,000
Interest Rate
6.9%
Mortgage Type
VA
Create a Home Valuation Report for This Property
The Home Valuation Report is an in-depth analysis detailing your home's value as well as a comparison with similar homes in the area
Home Values in the Area
Average Home Value in this Area
Purchase History
| Date | Buyer | Sale Price | Title Company |
|---|---|---|---|
| Stoll Anthony E | $136,000 | -- |
Source: Public Records
Mortgage History
| Date | Status | Borrower | Loan Amount |
|---|---|---|---|
| Open | Stoll Anthony E | $93,776 | |
| Closed | Stoll Anthony E | $136,000 | |
| Previous Owner | Stoll Anthony E | $100,000 |
Source: Public Records
Tax History
| Year | Tax Paid | Tax Assessment Tax Assessment Total Assessment is a certain percentage of the fair market value that is determined by local assessors to be the total taxable value of land and additions on the property. | Land | Improvement |
|---|---|---|---|---|
| 2025 | $5,456 | $196,840 | $44,240 | $152,600 |
| 2024 | $5,534 | $150,220 | $34,510 | $115,710 |
| 2023 | $5,405 | $150,220 | $34,510 | $115,710 |
| 2022 | $5,346 | $150,220 | $34,510 | $115,710 |
| 2021 | $5,214 | $150,220 | $34,510 | $115,710 |
| 2020 | $4,513 | $125,370 | $40,600 | $84,770 |
| 2019 | $4,513 | $125,370 | $40,600 | $84,770 |
| 2018 | $4,513 | $125,370 | $40,600 | $84,770 |
| 2017 | $4,513 | $125,370 | $40,600 | $84,770 |
| 2016 | $4,513 | $125,370 | $40,600 | $84,770 |
| 2015 | $4,416 | $127,680 | $42,770 | $84,910 |
| 2014 | $4,346 | $127,680 | $42,770 | $84,910 |
Source: Public Records
Map
Nearby Homes
- 68 New St
- 85 Balance Rock Rd Unit 4
- 79 Balance Rock Rd Unit 12
- 79 Balance Rock Rd Unit 8
- 75 Balance Rock Rd Unit 20
- 50 Balance Rock Rd Unit 16
- 41 Balance Rock Rd Unit 16
- 29 Balance Rock Rd Unit 5
- 11 Oxford Rd
- 73 Micko Dr
- 48 Micko Dr
- 67 Micko Dr
- 71 Micko Dr
- 69 Micko Dr
- 65 Micko Dr
- 42 Greenwood Cir
- 43 Balance Rock Rd Unit 1
- 22 Greenwood Cir
- 194 Eastwood Dr
- 61 Pershing Ave
Your Personal Tour Guide
Ask me questions while you tour the home.