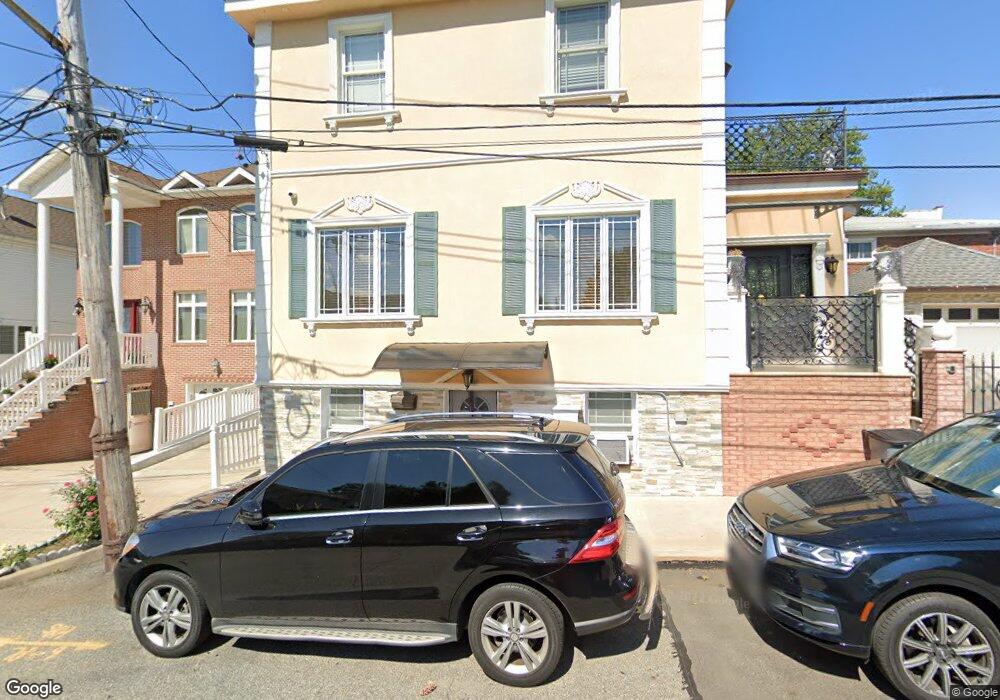
7 Pershing St Staten Island, NY 10305
South Beach NeighborhoodEstimated Value: $824,000 - $1,113,000
3
Beds
2
Baths
2,400
Sq Ft
$393/Sq Ft
Est. Value
About This Home
This home is located at 7 Pershing St, Staten Island, NY 10305 and is currently estimated at $943,175, approximately $392 per square foot. 7 Pershing St is a home located in Richmond County with nearby schools including P.S. 39 The Francis J. Murphy Jr. School, I.S. 49 Berta A Dreyfus, and Curtis High School.
Ownership History
Date
Name
Owned For
Owner Type
Purchase Details
Closed on
Dec 22, 2006
Sold by
Lepage Robert and Lepage Robert
Bought by
Dona Ali and Dona Elvira
Current Estimated Value
Home Financials for this Owner
Home Financials are based on the most recent Mortgage that was taken out on this home.
Original Mortgage
$360,000
Outstanding Balance
$213,201
Interest Rate
6.14%
Mortgage Type
Purchase Money Mortgage
Estimated Equity
$729,974
Create a Home Valuation Report for This Property
The Home Valuation Report is an in-depth analysis detailing your home's value as well as a comparison with similar homes in the area
Home Values in the Area
Average Home Value in this Area
Purchase History
| Date | Buyer | Sale Price | Title Company |
|---|---|---|---|
| Dona Ali | $475,000 | First Amer Title Ins Co Ny |
Source: Public Records
Mortgage History
| Date | Status | Borrower | Loan Amount |
|---|---|---|---|
| Open | Dona Ali | $360,000 |
Source: Public Records
Tax History
| Year | Tax Paid | Tax Assessment Tax Assessment Total Assessment is a certain percentage of the fair market value that is determined by local assessors to be the total taxable value of land and additions on the property. | Land | Improvement |
|---|---|---|---|---|
| 2025 | $6,698 | $53,880 | $7,558 | $46,322 |
| 2024 | $5,691 | $44,340 | $8,665 | $35,675 |
| 2023 | $5,766 | $33,350 | $7,385 | $25,965 |
| 2022 | $5,600 | $47,940 | $11,520 | $36,420 |
| 2021 | $6,571 | $40,500 | $11,520 | $28,980 |
| 2020 | $6,236 | $42,960 | $11,520 | $31,440 |
| 2019 | $5,814 | $42,960 | $11,520 | $31,440 |
| 2018 | $5,665 | $27,792 | $7,917 | $19,875 |
| 2017 | $5,623 | $27,582 | $10,764 | $16,818 |
| 2016 | $5,202 | $26,021 | $10,217 | $15,804 |
| 2015 | $4,445 | $24,549 | $8,520 | $16,029 |
| 2014 | $4,445 | $23,160 | $9,600 | $13,560 |
Source: Public Records
Map
Nearby Homes
- 16 Piave Ave Unit 1st Fl
- 16 Piave Ave Unit 2
- 16 Piave Ave
- 14 Piave Ave
- 15 Pershing St
- 28 Piave Ave
- 10 Piave Ave
- 19 Pershing St
- 14 Pershing St
- 330 Mcclean Ave
- 17 Piave Ave
- 32 Piave Ave
- 21 Piave Ave
- 334 Mcclean Ave
- 16 Pershing St
- 326 Mcclean Ave
- 0 Pershing St
- 27 Piave Ave
- 21 Pershing St
- 338 Mcclean Ave
Your Personal Tour Guide
Ask me questions while you tour the home.