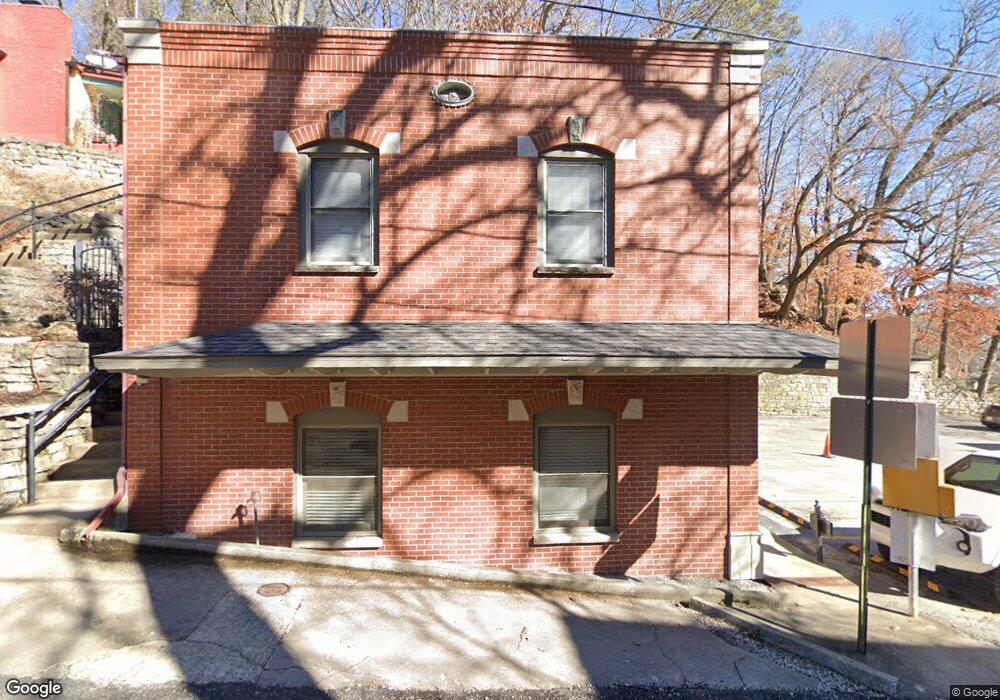
7 Pine St Eureka Springs, AR 72632
Estimated Value: $681,923 - $824,000
Studio
--
Bath
1,900
Sq Ft
$402/Sq Ft
Est. Value
About This Home
This home is located at 7 Pine St, Eureka Springs, AR 72632 and is currently estimated at $763,974, approximately $402 per square foot. 7 Pine St is a home located in Carroll County with nearby schools including Eureka Springs Elementary School, Eureka Springs Middle School, and Eureka Springs High School.
Ownership History
Date
Name
Owned For
Owner Type
Purchase Details
Closed on
Jun 11, 2018
Sold by
Epley Charles P and Epley Janet M
Bought by
Sweet Spring Holdings Llc
Current Estimated Value
Home Financials for this Owner
Home Financials are based on the most recent Mortgage that was taken out on this home.
Original Mortgage
$691,194
Outstanding Balance
$503,457
Interest Rate
4.5%
Mortgage Type
New Conventional
Estimated Equity
$260,517
Purchase Details
Closed on
Dec 19, 1988
Bought by
Fr Lewis Epley
Create a Home Valuation Report for This Property
The Home Valuation Report is an in-depth analysis detailing your home's value as well as a comparison with similar homes in the area
Purchase History
| Date | Buyer | Sale Price | Title Company |
|---|---|---|---|
| Sweet Spring Holdings Llc | $365,000 | None Available | |
| Fr Lewis Epley | -- | -- |
Source: Public Records
Mortgage History
| Date | Status | Borrower | Loan Amount |
|---|---|---|---|
| Open | Sweet Spring Holdings Llc | $691,194 |
Source: Public Records
Tax History
| Year | Tax Paid | Tax Assessment Tax Assessment Total Assessment is a certain percentage of the fair market value that is determined by local assessors to be the total taxable value of land and additions on the property. | Land | Improvement |
|---|---|---|---|---|
| 2025 | $3,046 | $161,560 | $8,580 | $152,980 |
| 2024 | $2,769 | $101,300 | $8,580 | $92,720 |
| 2023 | $2,556 | $101,300 | $8,580 | $92,720 |
| 2022 | $2,343 | $101,300 | $8,580 | $92,720 |
| 2021 | $2,131 | $42,180 | $4,560 | $37,620 |
| 2020 | $2,131 | $42,180 | $4,560 | $37,620 |
| 2019 | $2,150 | $42,180 | $4,560 | $37,620 |
| 2018 | $2,238 | $43,920 | $4,560 | $39,360 |
| 2017 | $2,237 | $43,920 | $4,560 | $39,360 |
| 2016 | $2,177 | $43,080 | $4,560 | $38,520 |
| 2014 | -- | $43,080 | $4,560 | $38,520 |
Source: Public Records
Map
Nearby Homes
Your Personal Tour Guide
Ask me questions while you tour the home.