7 Roberts St Quincy, MA 02169
South Quincy NeighborhoodEstimated Value: $786,000 - $894,000
About This Home
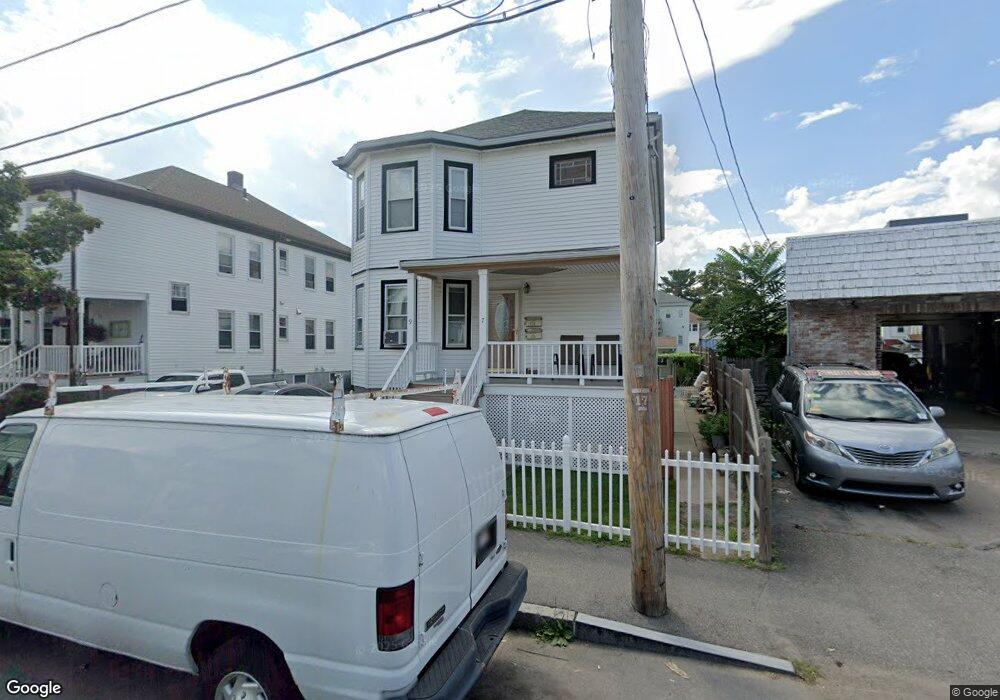
This home is located at 7 Roberts St, Quincy, MA 02169 and is currently estimated at $829,275, approximately $418 per square foot. 7 Roberts St is a home located in Norfolk County with nearby schools including Lincoln-Hancock Community School, South West Middle School, and Quincy High School.
Ownership History
We collect this data history from publicly available records. To have your information removed, we recommend requesting removal directly through your county’s website.
Purchase Details
Home Financials for this Owner
Home Financials are based on the most recent Mortgage that was taken out on this home.Purchase Details
Home Financials for this Owner
Home Financials are based on the most recent Mortgage that was taken out on this home.Purchase Details
Home Financials for this Owner
Home Financials are based on the most recent Mortgage that was taken out on this home.Home Values in the Area
Average Home Value in this Area
Purchase History
We collect this data history from publicly available records. To have your information removed, we recommend requesting removal directly through your county’s website.
| Date | Buyer | Sale Price | Title Company |
|---|---|---|---|
| $392,000 | -- | ||
| $392,000 | -- | ||
| $240,000 | -- | ||
| $141,500 | -- |
Mortgage History
We collect this data history from publicly available records. To have your information removed, we recommend requesting removal directly through your county’s website.
| Date | Status | Borrower | Loan Amount |
|---|---|---|---|
| Open | $250,000 | ||
| Closed | $250,000 | ||
| Previous Owner | $216,000 | ||
| Previous Owner | $85,000 |
Tax History
We collect this data history from publicly available records. To have your information removed, we recommend requesting removal directly through your county’s website.
| Year | Tax Paid | Tax Assessment Tax Assessment Total Assessment is a certain percentage of the fair market value that is determined by local assessors to be the total taxable value of land and additions on the property. | Land | Improvement |
|---|---|---|---|---|
| 2025 | $8,609 | $746,700 | $269,900 | $476,800 |
| 2024 | $8,108 | $719,400 | $257,000 | $462,400 |
| 2023 | $7,587 | $681,700 | $233,700 | $448,000 |
| 2022 | $7,340 | $612,700 | $194,700 | $418,000 |
| 2021 | $7,187 | $592,000 | $194,700 | $397,300 |
| 2020 | $7,124 | $573,100 | $194,700 | $378,400 |
| 2019 | $6,458 | $514,600 | $183,700 | $330,900 |
| 2018 | $6,003 | $450,000 | $170,100 | $279,900 |
| 2017 | $6,046 | $426,700 | $162,000 | $264,700 |
| 2016 | $5,366 | $373,700 | $140,900 | $232,800 |
| 2015 | $5,278 | $361,500 | $140,900 | $220,600 |
| 2014 | $4,531 | $304,900 | $140,900 | $164,000 |
Map
- 91 Garfield St
- 18 Prout St
- 40 Quarry St
- 210 Centre St Unit 14
- 95 & 97 Copeland St
- 53 Packards Ln Unit 3
- 31 Station St
- 16 Parker St
- 58 Village Dr
- 8 Jackson St Unit C1
- 30 Tinson Rd
- 166 Suomi Rd
- 3 Gothland St
- 67-69 Penn St
- 21 Totman St Unit 205
- 21 Totman St Unit 210
- 21 Totman St Unit 302
- 21 Totman St Unit 403
- 21 Totman St Unit 301
- 20 Miller St Unit 2
- 390-392 Water St
- 5 Grossman St
- 394 Water St
- 11 Grossman St Unit 11
- 0 Grossman St Unit 1
- 9 Grossman St
- 387 Water St
- 391 Water St Unit B
- 391 Water St Unit 3
- 13 Grossman St
- 380 Water St Unit 386
- 10 Grossman St
- 385 Water St
- 393 Water St Unit 397
- 397 Water St
- 393 Water St Unit A
- 393 Water St Unit 3
- 393 Water St Unit 1
- 393 Water St Unit 2
- 393 Water St Unit 4
Ask me questions while you tour the home.