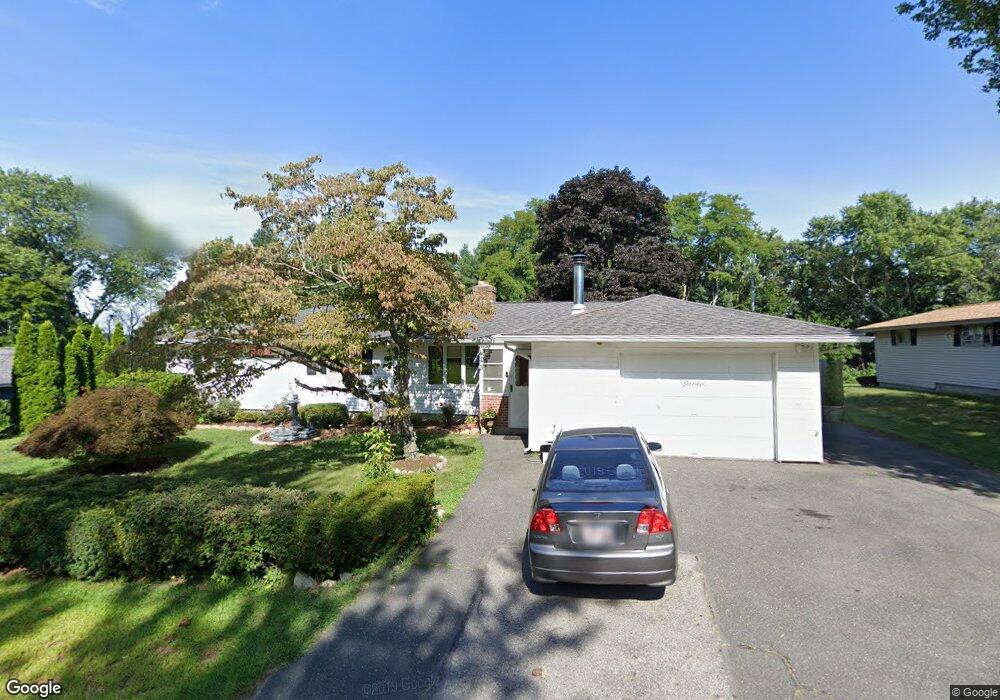
7 Saybrook Rd Framingham, MA 01701
Estimated Value: $584,000 - $648,000
4
Beds
2
Baths
1,598
Sq Ft
$381/Sq Ft
Est. Value
About This Home
This home is located at 7 Saybrook Rd, Framingham, MA 01701 and is currently estimated at $609,002, approximately $381 per square foot. 7 Saybrook Rd is a home located in Middlesex County with nearby schools including Framingham High School, Christa McAuliffe Charter School, and Happy Hollow School.
Ownership History
Date
Name
Owned For
Owner Type
Purchase Details
Closed on
May 2, 2023
Sold by
Seyedhassani Hadi and Seyedhassani Annamaria
Bought by
Seyedhassani Ft and Seyedhassani
Current Estimated Value
Create a Home Valuation Report for This Property
The Home Valuation Report is an in-depth analysis detailing your home's value as well as a comparison with similar homes in the area
Home Values in the Area
Average Home Value in this Area
Purchase History
We collect this data history from publicly available records. To have your information removed, we recommend requesting removal directly through your county’s website.
| Date | Buyer | Sale Price | Title Company |
|---|---|---|---|
| Seyedhassani Ft | -- | None Available |
Source: Public Records
Tax History
| Year | Tax Paid | Tax Assessment Tax Assessment Total Assessment is a certain percentage of the fair market value that is determined by local assessors to be the total taxable value of land and additions on the property. | Land | Improvement |
|---|---|---|---|---|
| 2025 | $6,308 | $528,300 | $265,500 | $262,800 |
| 2024 | $6,042 | $484,900 | $237,100 | $247,800 |
| 2023 | $5,722 | $437,100 | $211,600 | $225,500 |
| 2022 | $5,415 | $394,100 | $192,000 | $202,100 |
| 2021 | $5,270 | $375,100 | $184,600 | $190,500 |
| 2020 | $5,285 | $352,800 | $167,700 | $185,100 |
| 2019 | $5,171 | $336,200 | $167,700 | $168,500 |
| 2018 | $5,061 | $310,100 | $161,400 | $148,700 |
| 2017 | $4,968 | $297,300 | $156,700 | $140,600 |
| 2016 | $4,847 | $278,900 | $156,700 | $122,200 |
| 2015 | $4,802 | $269,500 | $157,100 | $112,400 |
Source: Public Records
Map
Nearby Homes
- 7 Ballydrain Rd
- 928 Concord St
- 22 Leonard Rd
- 109 Hastings St
- 46 Cochituate Rd Unit 106
- 164 Lockland Ave
- 350 Central St
- 15 Fenway Dr
- 61 Indian Head Rd
- 28 Valentine Rd
- 8 Sunset Dr
- 13 Michaud Dr
- 10 Nouvelle Way Unit 807
- 10 Nouvelle Way Unit 711
- 40 Nouvelle Way Unit 644
- 40 Nouvelle Way Unit 241
- 369 Grant St Unit 1
- 26 Beulah St
- 94 Spruce St
- 19 Chestnut St
Your Personal Tour Guide
Ask me questions while you tour the home.