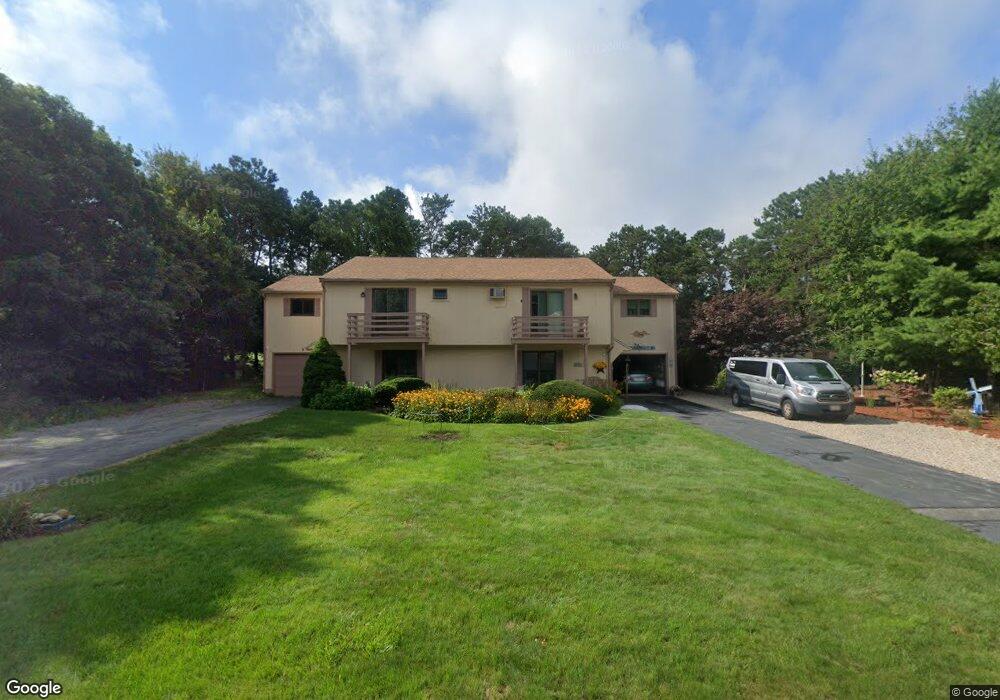
7 Surrey Ln Bourne, MA 2532
Monument Beach NeighborhoodEstimated Value: $384,000 - $627,000
3
Beds
2
Baths
1,988
Sq Ft
$227/Sq Ft
Est. Value
About This Home
This home is located at 7 Surrey Ln, Bourne, MA 2532 and is currently estimated at $451,853, approximately $227 per square foot. 7 Surrey Ln is a home located in Barnstable County with nearby schools including Bourne High School, St Margaret Regional School, and Cadence Academy Preschool - Bourne.
Ownership History
Date
Name
Owned For
Owner Type
Purchase Details
Closed on
Feb 6, 2020
Sold by
Noble Jack L and Noble Sandra L
Bought by
Noble Sandra L and Noble Jack L
Current Estimated Value
Purchase Details
Closed on
Jun 28, 2002
Sold by
Wilder John A and Wilder Marie
Bought by
Balaschak Elizabeth K
Home Financials for this Owner
Home Financials are based on the most recent Mortgage that was taken out on this home.
Original Mortgage
$242,250
Interest Rate
6.92%
Mortgage Type
Purchase Money Mortgage
Purchase Details
Closed on
Feb 12, 1999
Sold by
Abel Mary
Bought by
Wilder Marie and Wilder John A
Create a Home Valuation Report for This Property
The Home Valuation Report is an in-depth analysis detailing your home's value as well as a comparison with similar homes in the area
Home Values in the Area
Average Home Value in this Area
Purchase History
| Date | Buyer | Sale Price | Title Company |
|---|---|---|---|
| Noble Sandra L | -- | None Available | |
| Noble Sandra L | -- | None Available | |
| Noble Jack L | -- | None Available | |
| Noble Jack L | -- | None Available | |
| Balaschak Elizabeth K | $255,000 | -- | |
| Balaschak Elizabeth K | $255,000 | -- | |
| Wilder Marie | $130,000 | -- | |
| Wilder Marie | $130,000 | -- |
Source: Public Records
Mortgage History
| Date | Status | Borrower | Loan Amount |
|---|---|---|---|
| Previous Owner | Wilder Marie | $242,250 |
Source: Public Records
Tax History
| Year | Tax Paid | Tax Assessment Tax Assessment Total Assessment is a certain percentage of the fair market value that is determined by local assessors to be the total taxable value of land and additions on the property. | Land | Improvement |
|---|---|---|---|---|
| 2025 | $2,256 | $288,800 | $0 | $288,800 |
| 2024 | $2,297 | $286,400 | $0 | $286,400 |
| 2023 | $2,523 | $286,400 | $0 | $286,400 |
| 2022 | $2,890 | $286,400 | $0 | $286,400 |
| 2021 | $3,085 | $286,400 | $0 | $286,400 |
| 2020 | $3,146 | $292,900 | $0 | $292,900 |
| 2019 | $2,846 | $270,800 | $0 | $270,800 |
| 2018 | $2,631 | $249,600 | $0 | $249,600 |
| 2017 | $2,529 | $245,500 | $0 | $245,500 |
| 2016 | $2,160 | $212,600 | $0 | $212,600 |
| 2015 | $2,141 | $212,600 | $0 | $212,600 |
Source: Public Records
Map
Nearby Homes
- 27 Surrey Ln Unit 27
- 4 Hollyhock Knoll Ct Unit 4
- 4 Hollyhock Knoll Ct Unit 4
- 2 Applewood Ct
- 405 Village Dr Unit 405
- 5 Blue Meadow Ct Unit 5
- 5 Blue Meadow Ct Unit 5
- 12 Turnberry Rd Unit 12
- 13 Laurel Hill Ct
- 2 Amberwood Ct Unit 2
- 2 Amberwood Ct Unit 2
- 16 Amberwood Ct
- 44 Cotuit Rd
- 5 Zoli Ln
- 5 Harbor Hill Dr
- 4 Harbor Hill Dr
- 60 Sandwich Rd
- 119 Valley Bars Rd
- 77 Roundhouse Rd Unit 77
- 3 Honora Ln Unit 3
Your Personal Tour Guide
Ask me questions while you tour the home.