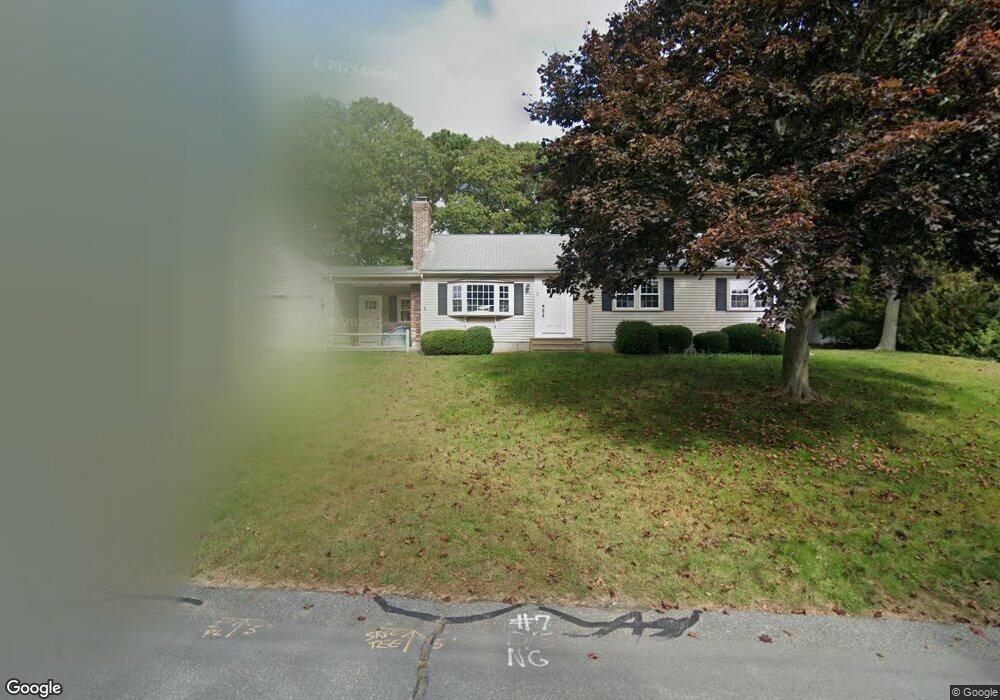
7 Tupelo Dr Harwich, MA 02645
Northwest Harwich NeighborhoodEstimated Value: $635,135 - $730,000
3
Beds
2
Baths
1,390
Sq Ft
$488/Sq Ft
Est. Value
About This Home
This home is located at 7 Tupelo Dr, Harwich, MA 02645 and is currently estimated at $678,284, approximately $487 per square foot. 7 Tupelo Dr is a home located in Barnstable County with nearby schools including Harwich Elementary School, Chatham Elementary School, and Monomoy Regional Middle School.
Ownership History
Date
Name
Owned For
Owner Type
Purchase Details
Closed on
Oct 22, 2020
Sold by
Vafiades Vendean V and Vafiades Vincent V
Bought by
Vafiades Vincent V and Vafiades Cheryl J
Current Estimated Value
Purchase Details
Closed on
Dec 18, 2014
Sold by
Vafiades Geraldean H
Bought by
Vafiades Ft and Vafiades Vendean V
Purchase Details
Closed on
May 22, 2013
Sold by
Vafiades Venizelos V and Vafiades Geraldean H
Bought by
Vafiades Geraldean H
Purchase Details
Closed on
May 27, 1981
Bought by
Vafiades Geraldean H
Create a Home Valuation Report for This Property
The Home Valuation Report is an in-depth analysis detailing your home's value as well as a comparison with similar homes in the area
Home Values in the Area
Average Home Value in this Area
Purchase History
| Date | Buyer | Sale Price | Title Company |
|---|---|---|---|
| Vafiades Vincent V | -- | None Available | |
| Vafiades Vendean V | -- | None Available | |
| Vafiades Ft | -- | -- | |
| Vafiades Geraldean H | -- | -- | |
| Vafiades Geraldean H | -- | -- |
Source: Public Records
Tax History
| Year | Tax Paid | Tax Assessment Tax Assessment Total Assessment is a certain percentage of the fair market value that is determined by local assessors to be the total taxable value of land and additions on the property. | Land | Improvement |
|---|---|---|---|---|
| 2025 | $3,561 | $602,600 | $205,600 | $397,000 |
| 2024 | $3,458 | $573,500 | $194,000 | $379,500 |
| 2023 | $3,310 | $498,500 | $176,300 | $322,200 |
| 2022 | $3,212 | $396,000 | $153,400 | $242,600 |
| 2021 | $3,044 | $354,000 | $139,400 | $214,600 |
| 2020 | $3,021 | $346,100 | $136,500 | $209,600 |
| 2019 | $2,828 | $326,200 | $131,200 | $195,000 |
| 2018 | $2,862 | $315,800 | $119,300 | $196,500 |
| 2017 | $2,642 | $294,500 | $108,700 | $185,800 |
| 2016 | $2,579 | $284,300 | $108,700 | $175,600 |
| 2015 | $2,486 | $277,100 | $106,500 | $170,600 |
| 2014 | $2,295 | $261,700 | $94,000 | $167,700 |
Source: Public Records
Map
Nearby Homes
- 92 Azalea Dr
- 1 Bentley Rd
- 9 Bentley Rd
- 3 Bentley Rd
- 5 Bentley Rd
- 7 Bentley Rd
- 1 Shore Dr
- 13 Rogers Rd
- 14 2nd St
- 26 Ryder Rd
- 13 Pepper Ln
- 359 Great Western Rd
- 36 Lakewood Dr
- L261 Queen Anne Rd
- 18 Old Campground
- 46 Trout Pond Ln
- 33 Old Colony Rd
- 2 Englewood Dr Unit A5
- 2 Englewood Dr Unit A5
- 13 Allen St
Your Personal Tour Guide
Ask me questions while you tour the home.