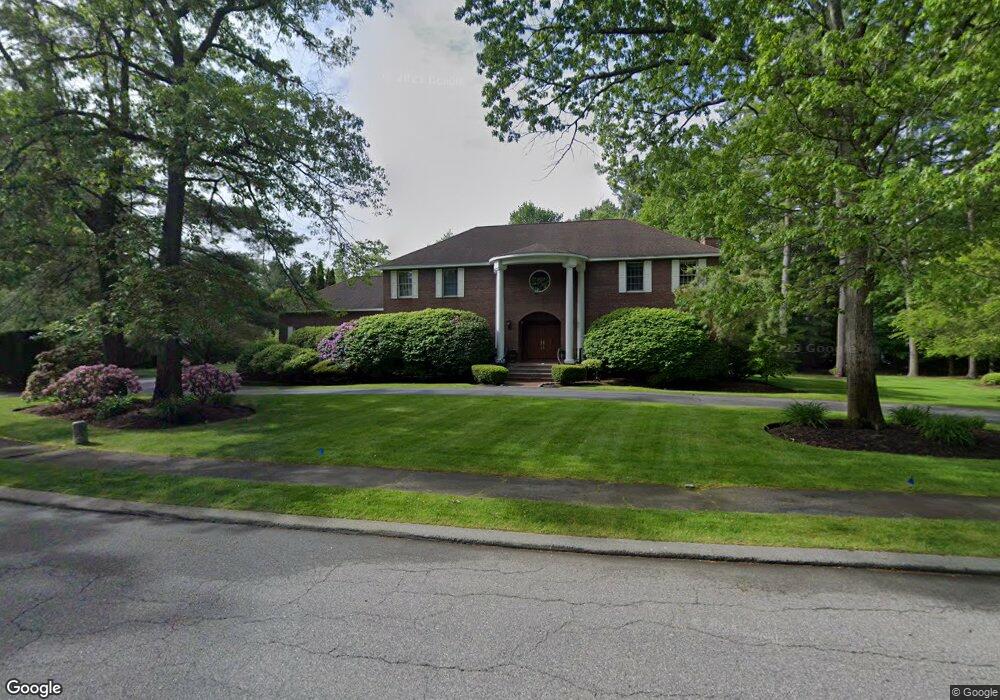
7 Westover Dr Lynnfield, MA 01940
Estimated Value: $1,524,000 - $1,963,000
4
Beds
4
Baths
4,665
Sq Ft
$380/Sq Ft
Est. Value
About This Home
This home is located at 7 Westover Dr, Lynnfield, MA 01940 and is currently estimated at $1,771,402, approximately $379 per square foot. 7 Westover Dr is a home located in Essex County with nearby schools including Lynnfield Middle School, Lynnfield High School, and Covenant Christian Academy.
Ownership History
Date
Name
Owned For
Owner Type
Purchase Details
Closed on
Oct 20, 1998
Sold by
Mcinnes Robert and Mcinnes Lucie F
Bought by
Giunta David and Giunta Wendy M
Current Estimated Value
Home Financials for this Owner
Home Financials are based on the most recent Mortgage that was taken out on this home.
Original Mortgage
$350,000
Outstanding Balance
$64,702
Interest Rate
6.8%
Mortgage Type
Purchase Money Mortgage
Estimated Equity
$1,706,700
Purchase Details
Closed on
May 15, 1991
Sold by
Fran Jo Rt
Bought by
Mcinnes Robert
Create a Home Valuation Report for This Property
The Home Valuation Report is an in-depth analysis detailing your home's value as well as a comparison with similar homes in the area
Home Values in the Area
Average Home Value in this Area
Purchase History
We collect this data history from publicly available records. To have your information removed, we recommend requesting removal directly through your county’s website.
| Date | Buyer | Sale Price | Title Company |
|---|---|---|---|
| Giunta David | $508,800 | -- | |
| Giunta David | $508,800 | -- | |
| Giunta David | $508,800 | -- | |
| Mcinnes Robert | $480,000 | -- |
Source: Public Records
Mortgage History
We collect this data history from publicly available records. To have your information removed, we recommend requesting removal directly through your county’s website.
| Date | Status | Borrower | Loan Amount |
|---|---|---|---|
| Open | Mcinnes Robert | $50,000 | |
| Open | Giunta David | $350,000 | |
| Closed | Mcinnes Robert | $350,000 |
Source: Public Records
Tax History
| Year | Tax Paid | Tax Assessment Tax Assessment Total Assessment is a certain percentage of the fair market value that is determined by local assessors to be the total taxable value of land and additions on the property. | Land | Improvement |
|---|---|---|---|---|
| 2025 | $15,835 | $1,499,500 | $721,000 | $778,500 |
| 2024 | $15,332 | $1,458,800 | $700,000 | $758,800 |
| 2023 | $14,626 | $1,294,300 | $621,000 | $673,300 |
| 2022 | $13,961 | $1,164,400 | $581,500 | $582,900 |
| 2021 | $13,042 | $982,800 | $443,300 | $539,500 |
| 2020 | $13,150 | $944,700 | $403,800 | $540,900 |
| 2019 | $13,141 | $944,700 | $403,800 | $540,900 |
| 2018 | $12,999 | $944,700 | $403,800 | $540,900 |
| 2017 | $12,747 | $925,000 | $384,100 | $540,900 |
| 2016 | $12,586 | $868,000 | $370,300 | $497,700 |
| 2015 | $12,572 | $867,600 | $369,900 | $497,700 |
Source: Public Records
Map
Nearby Homes
Your Personal Tour Guide
Ask me questions while you tour the home.