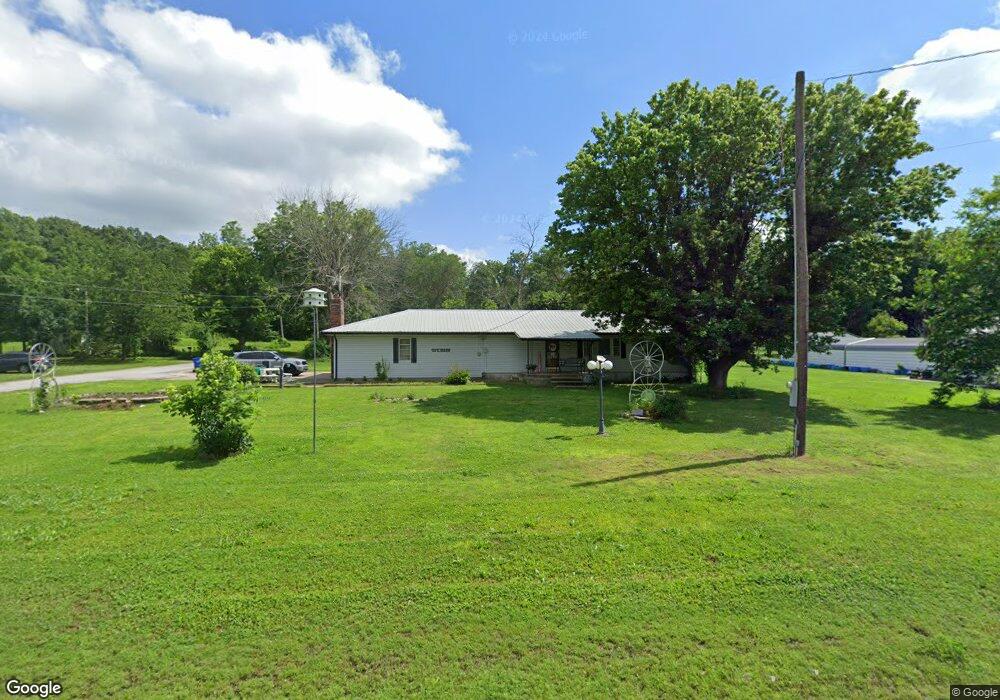
70 E Main St Peoria, OK 74363
Estimated Value: $103,000 - $187,000
3
Beds
1
Bath
1,628
Sq Ft
$89/Sq Ft
Est. Value
About This Home
This home is located at 70 E Main St, Peoria, OK 74363 and is currently estimated at $144,331, approximately $88 per square foot. 70 E Main St is a home located in Ottawa County with nearby schools including Quapaw Elementary School, Quapaw Middle School, and Quapaw High School.
Ownership History
Date
Name
Owned For
Owner Type
Purchase Details
Closed on
Feb 13, 2026
Sold by
Sullivan Derek and Sullivan Kamrie D
Bought by
Sullivan Derek L and Sullivan Kamrie D
Current Estimated Value
Home Financials for this Owner
Home Financials are based on the most recent Mortgage that was taken out on this home.
Original Mortgage
$115,500
Outstanding Balance
$115,500
Interest Rate
6.5%
Mortgage Type
New Conventional
Estimated Equity
$28,831
Purchase Details
Closed on
Nov 24, 2021
Sold by
Ludlum James F and Ludlum Lottie
Bought by
Sullivan Derek and Hayes Henry
Home Financials for this Owner
Home Financials are based on the most recent Mortgage that was taken out on this home.
Original Mortgage
$65,000
Interest Rate
3.05%
Mortgage Type
Commercial
Purchase Details
Closed on
Dec 26, 2004
Sold by
Ludlum Eulah C and Ludlum James F
Bought by
Ludlum James F and Ludlum Lottie
Create a Home Valuation Report for This Property
The Home Valuation Report is an in-depth analysis detailing your home's value as well as a comparison with similar homes in the area
Purchase History
| Date | Buyer | Sale Price | Title Company |
|---|---|---|---|
| Sullivan Derek L | -- | Photo Abstract | |
| Sullivan Derek | $65,000 | Photo Abstract Co | |
| Sullivan Derek | -- | None Available | |
| Ludlum James F | -- | None Available |
Source: Public Records
Mortgage History
| Date | Status | Borrower | Loan Amount |
|---|---|---|---|
| Open | Sullivan Derek L | $115,500 | |
| Previous Owner | Sullivan Derek | $65,000 |
Source: Public Records
Tax History
| Year | Tax Paid | Tax Assessment Tax Assessment Total Assessment is a certain percentage of the fair market value that is determined by local assessors to be the total taxable value of land and additions on the property. | Land | Improvement |
|---|---|---|---|---|
| 2025 | $613 | $7,410 | $324 | $7,086 |
| 2024 | $614 | $7,410 | $324 | $7,086 |
| 2023 | $614 | $7,410 | $324 | $7,086 |
| 2022 | $630 | $7,410 | $324 | $7,086 |
| 2021 | $433 | $8,087 | $115 | $7,972 |
| 2020 | $435 | $8,124 | $152 | $7,972 |
| 2019 | $435 | $8,124 | $152 | $7,972 |
| 2018 | $435 | $8,124 | $152 | $7,972 |
| 2017 | $435 | $8,124 | $275 | $7,849 |
| 2016 | $435 | $8,124 | $369 | $7,755 |
| 2015 | $554 | $8,124 | $369 | $7,755 |
| 2014 | $436 | $8,124 | $369 | $7,755 |
Source: Public Records
Map
Nearby Homes
Your Personal Tour Guide
Ask me questions while you tour the home.