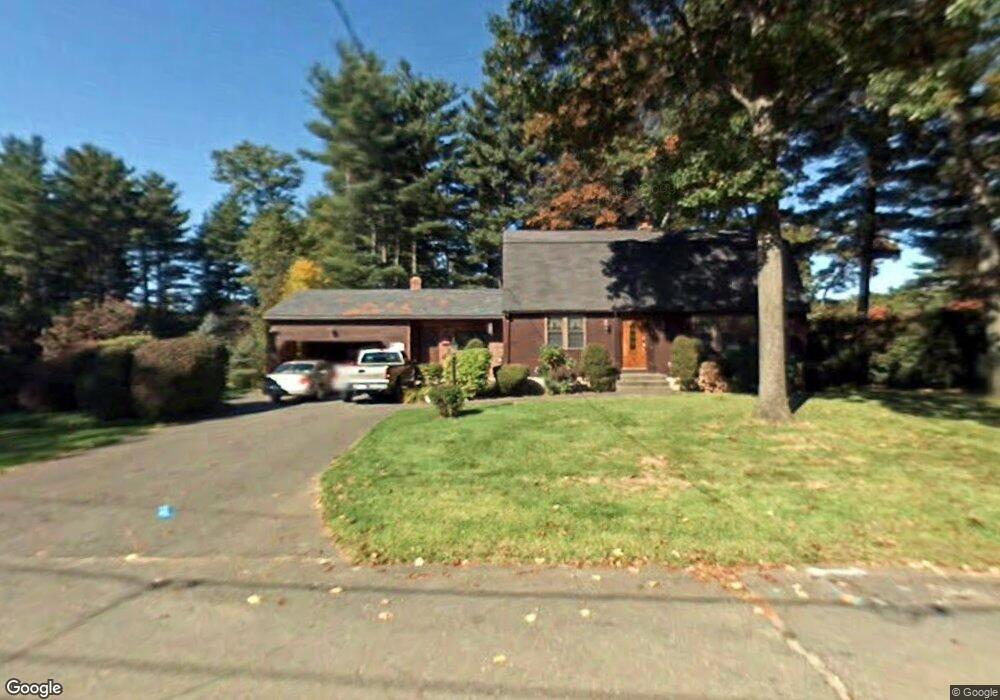
70 Kittredge Dr Westfield, MA 01085
Estimated Value: $401,537 - $510,000
4
Beds
2
Baths
2,007
Sq Ft
$230/Sq Ft
Est. Value
About This Home
This home is located at 70 Kittredge Dr, Westfield, MA 01085 and is currently estimated at $461,134, approximately $229 per square foot. 70 Kittredge Dr is a home located in Hampden County with nearby schools including Westfield High School, White Oak School, and Saint Mary High School.
Ownership History
Date
Name
Owned For
Owner Type
Purchase Details
Closed on
Dec 19, 2024
Sold by
Jermyn Irt and Cote
Bought by
Jermyn Robert A
Current Estimated Value
Purchase Details
Closed on
Oct 19, 2022
Sold by
Jermyn Robert A and Jermyn Maureen J
Bought by
Jermyn Irt and Cote
Purchase Details
Closed on
Dec 7, 1971
Bought by
Jermyn Robert A and Jermyn Maureen J
Create a Home Valuation Report for This Property
The Home Valuation Report is an in-depth analysis detailing your home's value as well as a comparison with similar homes in the area
Home Values in the Area
Average Home Value in this Area
Purchase History
| Date | Buyer | Sale Price | Title Company |
|---|---|---|---|
| Jermyn Robert A | -- | None Available | |
| Jermyn Robert A | -- | None Available | |
| Jermyn Irt | -- | None Available | |
| Jermyn Irt | -- | None Available | |
| Jermyn Robert A | -- | -- |
Source: Public Records
Mortgage History
| Date | Status | Borrower | Loan Amount |
|---|---|---|---|
| Previous Owner | Jermyn Robert A | $70,000 |
Source: Public Records
Tax History
| Year | Tax Paid | Tax Assessment Tax Assessment Total Assessment is a certain percentage of the fair market value that is determined by local assessors to be the total taxable value of land and additions on the property. | Land | Improvement |
|---|---|---|---|---|
| 2025 | $5,205 | $342,900 | $118,300 | $224,600 |
| 2024 | $5,208 | $326,100 | $107,600 | $218,500 |
| 2023 | $4,820 | $294,400 | $102,400 | $192,000 |
| 2022 | $4,820 | $260,700 | $91,400 | $169,300 |
| 2021 | $2,261 | $247,100 | $86,000 | $161,100 |
| 2020 | $4,522 | $234,900 | $86,000 | $148,900 |
| 2019 | $4,428 | $225,100 | $82,300 | $142,800 |
| 2018 | $4,358 | $225,100 | $82,300 | $142,800 |
| 2017 | $4,269 | $219,800 | $83,100 | $136,700 |
| 2016 | $4,273 | $219,800 | $83,100 | $136,700 |
| 2015 | $4,058 | $218,900 | $83,100 | $135,800 |
| 2014 | $3,035 | $218,900 | $83,100 | $135,800 |
Source: Public Records
Map
Nearby Homes
- 38 Klondike Ave
- 19 Arch Rd
- 0 Lockhouse Rd Unit 73496193
- 289 Holyoke Rd
- 88 Woodmont St
- 9 Montgomery St
- Lot 5 Montgomery
- 68 Warfield Dr
- 0 Char Dr
- 713 Holyoke Rd
- 97 Mechanic St
- 23 Susan Dr
- 114 Otis St Unit C
- 100 Meadow St
- 19 Kellogg St
- 205 Elm St
- 238 Prospect Street Extension
- 288 Buck Pond Rd
- 13 Hampden St
- 13 Green Ave
Your Personal Tour Guide
Ask me questions while you tour the home.