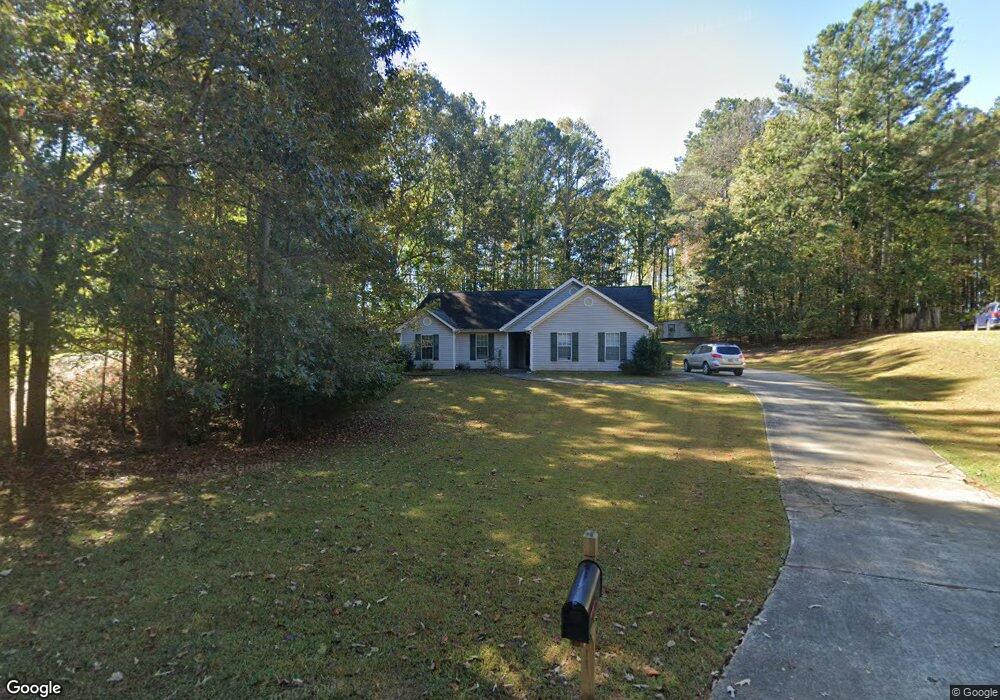
70 Paces Landing Place Newnan, GA 30263
Estimated Value: $283,626 - $322,000
3
Beds
2
Baths
1,412
Sq Ft
$219/Sq Ft
Est. Value
About This Home
This home is located at 70 Paces Landing Place, Newnan, GA 30263 and is currently estimated at $309,907, approximately $219 per square foot. 70 Paces Landing Place is a home located in Coweta County with nearby schools including Brooks Elementary School, Madras Middle School, and Northgate High School.
Ownership History
Date
Name
Owned For
Owner Type
Purchase Details
Closed on
Aug 28, 2006
Sold by
Camp Ed S
Bought by
Maltbie Richard W and Maltbie Cheryl C
Current Estimated Value
Home Financials for this Owner
Home Financials are based on the most recent Mortgage that was taken out on this home.
Original Mortgage
$118,800
Outstanding Balance
$70,607
Interest Rate
6.67%
Mortgage Type
New Conventional
Estimated Equity
$239,300
Purchase Details
Closed on
Feb 28, 1997
Sold by
Richard E Perry Homes
Bought by
Sanders Kevin W and Sanders Carmen J
Home Financials for this Owner
Home Financials are based on the most recent Mortgage that was taken out on this home.
Original Mortgage
$89,775
Interest Rate
7.9%
Mortgage Type
FHA
Purchase Details
Closed on
Apr 29, 1996
Bought by
Richard E Perry Home
Purchase Details
Closed on
Jan 19, 1995
Bought by
Evergreen Communitie
Purchase Details
Closed on
Jul 31, 1978
Bought by
Francavilla Carl and Francavilla J
Create a Home Valuation Report for This Property
The Home Valuation Report is an in-depth analysis detailing your home's value as well as a comparison with similar homes in the area
Purchase History
| Date | Buyer | Sale Price | Title Company |
|---|---|---|---|
| Maltbie Richard W | $148,500 | -- | |
| Sanders Kevin W | $91,900 | -- | |
| Richard E Perry Home | $71,600 | -- | |
| Evergreen Communitie | $222,200 | -- | |
| Francavilla Carl | -- | -- |
Source: Public Records
Mortgage History
| Date | Status | Borrower | Loan Amount |
|---|---|---|---|
| Open | Maltbie Richard W | $118,800 | |
| Previous Owner | Sanders Kevin W | $89,775 |
Source: Public Records
Tax History
| Year | Tax Paid | Tax Assessment Tax Assessment Total Assessment is a certain percentage of the fair market value that is determined by local assessors to be the total taxable value of land and additions on the property. | Land | Improvement |
|---|---|---|---|---|
| 2025 | $2,239 | $99,240 | $22,000 | $77,240 |
| 2024 | $2,138 | $94,641 | $22,000 | $72,641 |
| 2023 | $2,138 | $89,840 | $22,000 | $67,840 |
Source: Public Records
Map
Nearby Homes
- 51 Conifer Ct Unit 71
- 280 Atlantica Dr Unit 45
- 326 Atlantica Dr
- 331 Atlantica Dr
- 127 Atlantica Dr Unit 86
- 128 Atlantica Dr Unit 30
- 17 Hedge Ct
- 15 Ingram Ct
- 255 Hillbrook Chase
- 8 Ranan Ln
- 28 Fernwood Ct
- 140 Quiet Cove Unit LOT 46
- 3286 Happy Valley Cir Unit LOT 1
- 3230 Happy Valley Cir Unit LOT 3
- 16 Inland Point
- 100 S Shore Dr
- 85 High Garden Terrace
- 2464 N Hwy 29 Unit 1
- 420 Lamar Smith Dr Unit LOT 12
- 374 S Alexander Creek Rd
- 80 Paces Landing Place
- 60 Paces Landing Place
- 87 Paces Landing Place
- 90 Paces Landing Place
- 50 Paces Landing Place Unit 33
- 50 Paces Landing Place
- 55 Paces Landing Place
- 95 Paces Landing Place
- 100 Paces Landing Place
- 105 Paces Landing Place
- 207 Paces Landing Way
- 110 Paces Landing Place
- 30 Paces Landing Place
- 115 Paces Landing Place
- 35 Paces Landing Place
- 120 Paces Landing Place
- 20 Paces Landing Place
- 125 Paces Landing Place
- 25 Paces Landing Place Unit 40
- 25 Paces Landing Place
Your Personal Tour Guide
Ask me questions while you tour the home.