70 Tower Rd West Warwick, RI 02893
West Warwick Centre NeighborhoodEstimated Value: $395,000 - $444,000
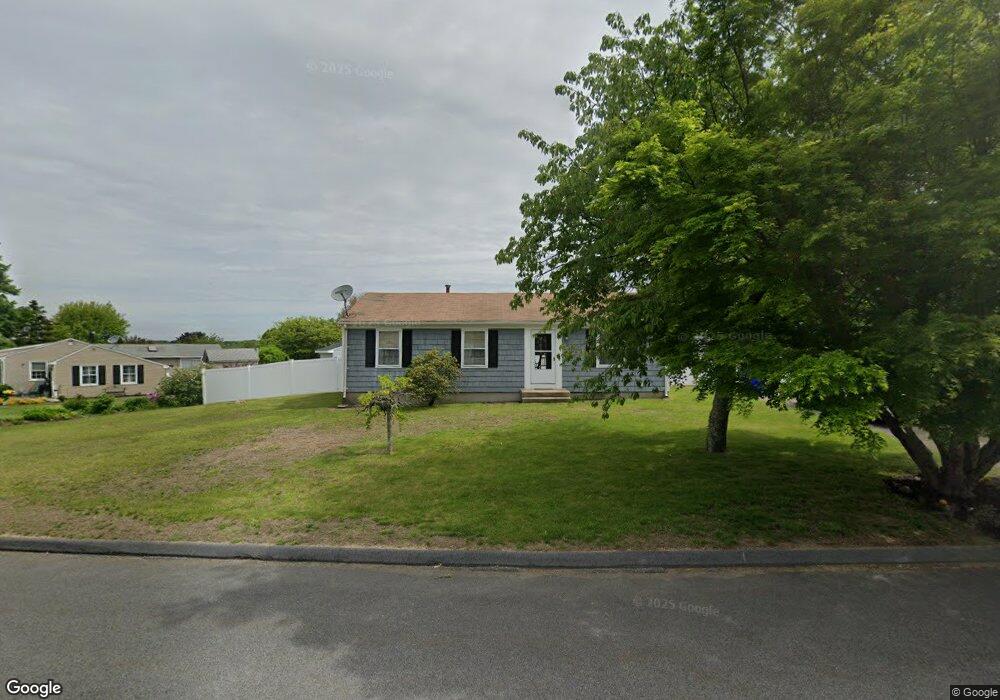
About This Home
This home is located at 70 Tower Rd, West Warwick, RI 02893 and is currently estimated at $417,164, approximately $434 per square foot. 70 Tower Rd is a home located in Kent County with nearby schools including West Warwick High School, Islamic School of Rhode Island, and St Joseph School.
Ownership History
We collect this data history from publicly available records. To have your information removed, we recommend requesting removal directly through your county’s website.
Purchase Details
Home Financials for this Owner
Home Financials are based on the most recent Mortgage that was taken out on this home.Purchase Details
Purchase Details
Purchase Details
Home Values in the Area
Average Home Value in this Area
Purchase History
We collect this data history from publicly available records. To have your information removed, we recommend requesting removal directly through your county’s website.
| Date | Buyer | Sale Price | Title Company |
|---|---|---|---|
| $150,000 | -- | ||
| $138,925 | -- | ||
| $235,000 | -- | ||
| $140,000 | -- |
Mortgage History
We collect this data history from publicly available records. To have your information removed, we recommend requesting removal directly through your county’s website.
| Date | Status | Borrower | Loan Amount |
|---|---|---|---|
| Open | $27,383 | ||
| Open | $147,283 |
Tax History
We collect this data history from publicly available records. To have your information removed, we recommend requesting removal directly through your county’s website.
| Year | Tax Paid | Tax Assessment Tax Assessment Total Assessment is a certain percentage of the fair market value that is determined by local assessors to be the total taxable value of land and additions on the property. | Land | Improvement |
|---|---|---|---|---|
| 2025 | $4,539 | $317,600 | $115,700 | $201,900 |
| 2024 | $4,385 | $234,600 | $82,700 | $151,900 |
| 2023 | $4,298 | $234,600 | $82,700 | $151,900 |
| 2022 | $4,232 | $234,600 | $82,700 | $151,900 |
| 2021 | $3,970 | $172,600 | $61,100 | $111,500 |
| 2020 | $3,970 | $172,600 | $61,100 | $111,500 |
| 2019 | $5,061 | $172,600 | $61,100 | $111,500 |
| 2018 | $3,661 | $134,700 | $50,300 | $84,400 |
| 2017 | $3,544 | $134,700 | $50,300 | $84,400 |
| 2016 | $3,481 | $134,700 | $50,300 | $84,400 |
| 2015 | $3,401 | $131,000 | $50,300 | $80,700 |
| 2014 | $832 | $131,000 | $50,300 | $80,700 |
Map
- 100 Panto Rd
- 325 New London Ave Unit A1
- 351 New London Ave Unit 302
- 351 New London Ave Unit 408
- 30 Potter Ave
- 12 Grove St
- 32 Harris Ave
- 26 Fornelli St
- 10 John St
- 37 Gerald St
- 2 Duke St Unit D
- 61 Lafayette St
- 55 South St Unit 1
- 74 Youngs Ave
- 34 Vine St
- 6 Middle St
- 7 Ledgemont Dr
- 22 Greene St
- 479 Providence St Unit C4
- 39 Sunrise Ave
Ask me questions while you tour the home.