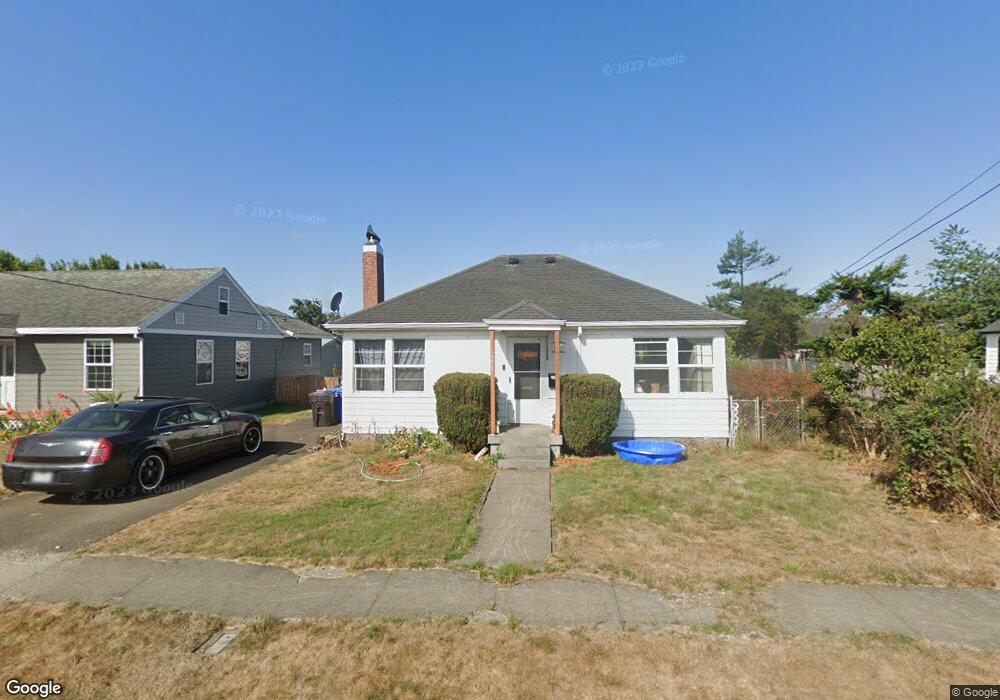
702 Elm Ave Tillamook, OR 97141
Estimated Value: $275,000 - $310,000
2
Beds
1
Bath
835
Sq Ft
$355/Sq Ft
Est. Value
About This Home
This home is located at 702 Elm Ave, Tillamook, OR 97141 and is currently estimated at $296,214, approximately $354 per square foot. 702 Elm Ave is a home located in Tillamook County with nearby schools including Tillamook High School.
Ownership History
Date
Name
Owned For
Owner Type
Purchase Details
Closed on
Jul 6, 2016
Sold by
Thompson Ryan J and Thompson Dawna L
Bought by
Eley Robyn K
Current Estimated Value
Home Financials for this Owner
Home Financials are based on the most recent Mortgage that was taken out on this home.
Original Mortgage
$160,550
Outstanding Balance
$126,514
Interest Rate
3.6%
Mortgage Type
New Conventional
Estimated Equity
$169,700
Purchase Details
Closed on
Oct 9, 2013
Sold by
Burback George M
Bought by
Thompson Ryan J and Thompson Dawna L
Create a Home Valuation Report for This Property
The Home Valuation Report is an in-depth analysis detailing your home's value as well as a comparison with similar homes in the area
Home Values in the Area
Average Home Value in this Area
Purchase History
We collect this data history from publicly available records. To have your information removed, we recommend requesting removal directly through your county’s website.
| Date | Buyer | Sale Price | Title Company |
|---|---|---|---|
| Eley Robyn K | $169,000 | First American | |
| Thompson Ryan J | $90,000 | First American |
Source: Public Records
Mortgage History
We collect this data history from publicly available records. To have your information removed, we recommend requesting removal directly through your county’s website.
| Date | Status | Borrower | Loan Amount |
|---|---|---|---|
| Open | Eley Robyn K | $160,550 |
Source: Public Records
Tax History
| Year | Tax Paid | Tax Assessment Tax Assessment Total Assessment is a certain percentage of the fair market value that is determined by local assessors to be the total taxable value of land and additions on the property. | Land | Improvement |
|---|---|---|---|---|
| 2025 | $1,409 | $116,710 | $48,790 | $67,920 |
| 2024 | $1,339 | $113,320 | $47,370 | $65,950 |
| 2023 | $1,327 | $110,020 | $45,990 | $64,030 |
| 2022 | $1,282 | $106,820 | $44,650 | $62,170 |
| 2021 | $1,244 | $103,710 | $43,350 | $60,360 |
| 2020 | $1,210 | $100,690 | $42,090 | $58,600 |
| 2019 | $1,179 | $97,760 | $40,860 | $56,900 |
| 2018 | $1,149 | $94,920 | $39,670 | $55,250 |
| 2017 | $1,120 | $92,160 | $38,510 | $53,650 |
| 2016 | $1,078 | $89,480 | $37,390 | $52,090 |
| 2015 | $1,057 | $86,880 | $36,300 | $50,580 |
| 2014 | $1,039 | $84,350 | $35,240 | $49,110 |
| 2013 | -- | $81,900 | $34,210 | $47,690 |
Source: Public Records
Map
Nearby Homes
- 1403 5th St
- 702 Ash Ave
- 1614 5th St
- 1802 8th St
- 1806 8th St
- 1806 10th St
- 915 Stillwell Ave
- 608 Cottonwood Ave
- 1708 4th St
- 116 Cedar Ave
- 02600 12th St
- 2213 10th St
- 17805 U S 101 S
- 2404 10th St
- TL# 02100 Wilson River Hwy
- 00201 Wilson River Hwy
- Parcel 1 Wilson River Hwy
- Parcel 2 Wilson River Hwy
- 2410 3rd St
- 2418 1st St
Your Personal Tour Guide
Ask me questions while you tour the home.