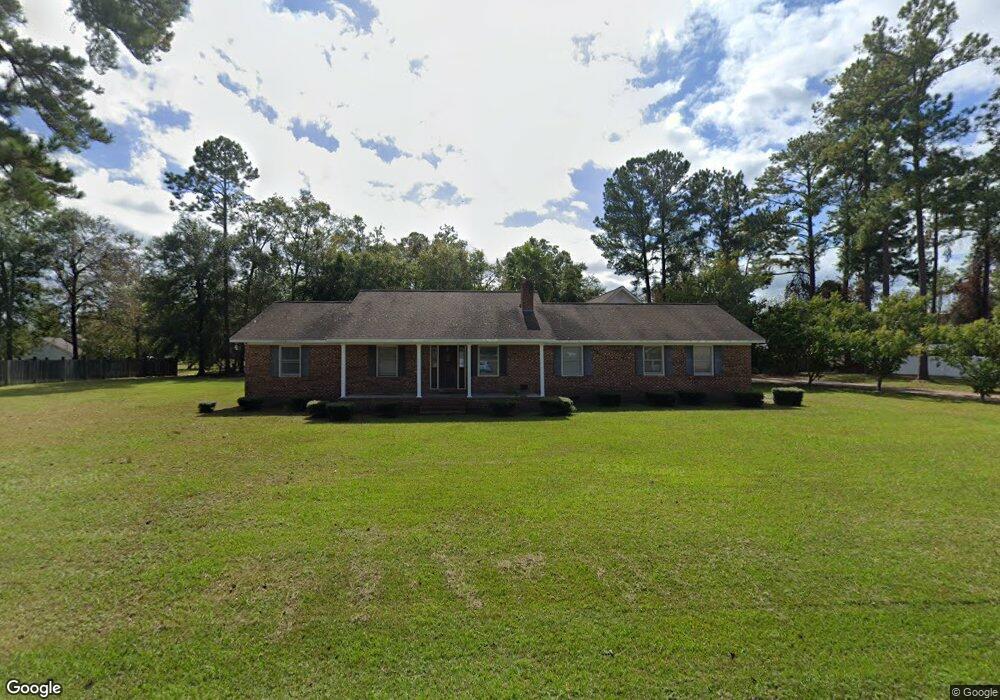
702 Saddle Cir Waycross, GA 31503
Estimated Value: $365,000 - $480,000
3
Beds
2
Baths
1,862
Sq Ft
$224/Sq Ft
Est. Value
About This Home
This home is located at 702 Saddle Cir, Waycross, GA 31503 and is currently estimated at $417,298, approximately $224 per square foot. 702 Saddle Cir is a home located in Ware County with nearby schools including Memorial Drive Elementary School, Waycross Middle School, and Ware County High School.
Ownership History
Date
Name
Owned For
Owner Type
Purchase Details
Closed on
Oct 26, 2021
Sold by
Jarrard Curtis G
Bought by
Harris Tyrone
Current Estimated Value
Home Financials for this Owner
Home Financials are based on the most recent Mortgage that was taken out on this home.
Original Mortgage
$1,000,000
Outstanding Balance
$907,940
Interest Rate
2.8%
Mortgage Type
New Conventional
Estimated Equity
-$490,642
Purchase Details
Closed on
Jun 22, 2010
Sold by
Blount Toni M
Bought by
Jarrard Curtis G
Home Financials for this Owner
Home Financials are based on the most recent Mortgage that was taken out on this home.
Original Mortgage
$10,000,000
Interest Rate
4.83%
Mortgage Type
Credit Line Revolving
Purchase Details
Closed on
Nov 13, 2006
Sold by
Blount Marlene
Bought by
Blount Toni M and Jarrard Curtis G
Purchase Details
Closed on
Aug 29, 1989
Bought by
Blount Marlene
Purchase Details
Closed on
Oct 2, 1985
Create a Home Valuation Report for This Property
The Home Valuation Report is an in-depth analysis detailing your home's value as well as a comparison with similar homes in the area
Purchase History
We collect this data history from publicly available records. To have your information removed, we recommend requesting removal directly through your county’s website.
| Date | Buyer | Sale Price | Title Company |
|---|---|---|---|
| Harris Tyrone | $145,000 | -- | |
| Jarrard Curtis G | -- | -- | |
| Blount Toni M | $125,000 | -- | |
| Blount Marlene | $60,000 | -- | |
| -- | $8,000 | -- |
Source: Public Records
Mortgage History
We collect this data history from publicly available records. To have your information removed, we recommend requesting removal directly through your county’s website.
| Date | Status | Borrower | Loan Amount |
|---|---|---|---|
| Open | Harris Tyrone | $1,000,000 | |
| Previous Owner | Jarrard Curtis G | $10,000,000 |
Source: Public Records
Tax History
| Year | Tax Paid | Tax Assessment Tax Assessment Total Assessment is a certain percentage of the fair market value that is determined by local assessors to be the total taxable value of land and additions on the property. | Land | Improvement |
|---|---|---|---|---|
| 2025 | $3,441 | $136,368 | $12,000 | $124,368 |
| 2024 | $3,441 | $130,705 | $12,000 | $118,705 |
| 2023 | $3,364 | $95,172 | $11,500 | $83,672 |
| 2022 | $1,675 | $58,000 | $7,491 | $50,509 |
| 2021 | $2,776 | $88,504 | $11,500 | $77,004 |
| 2020 | $2,592 | $81,750 | $11,500 | $70,250 |
| 2019 | $2,498 | $77,246 | $11,500 | $65,746 |
| 2018 | $2,496 | $76,489 | $11,500 | $64,989 |
| 2017 | $2,494 | $76,489 | $11,500 | $64,989 |
| 2016 | $2,494 | $76,489 | $11,500 | $64,989 |
| 2015 | $2,213 | $67,258 | $14,000 | $53,258 |
| 2014 | $2,210 | $67,258 | $14,000 | $53,258 |
| 2013 | -- | $67,258 | $14,000 | $53,258 |
Source: Public Records
Map
Nearby Homes
- 851 Carriage Ln
- 627 Saddle Cir
- 664 Saddle Cir
- 932 Hitching Post Ln
- 606 Stonewall Jackson Place
- 716 Stonewall Jackson Place
- 3810 Driggers Rd
- 565 S Oaks Ct
- 1140 Highland Dr
- 3474 Wren Dr
- 264 Williams Loop
- 5018 Whitehall Church Rd
- 635 Tomberlin Rd
- 4408 Brunswick Hwy
- 763 Kentland Dr
- 670 Hillmont Dr
- 43 Dixie Ln
- 723 St Bernard Trail
- BA L5 Riverdale Dr
- 1049 Riverdale Dr
- 700 Saddle Cir
- 694 Saddle Cir
- 516 Grace Dr
- 826 Hitching Post Ln
- 825 Hitching Post Ln
- 514 Grace Dr
- 827 Saddle Cir
- 684 Saddle Cir
- 826 Carriage Ln
- 844 Hitching Post Ln
- 841 Hitching Post Ln
- 844 Carriage Ln
- 526 Grace Dr
- 0 Grace Dr
- 674 Saddle Cir
- 808 Saddle Cir
- 852 Hitching Post Ln
- 851 Hitching Post Ln
- 875 Carriage Ln
- 853 Saddle Cir
Your Personal Tour Guide
Ask me questions while you tour the home.