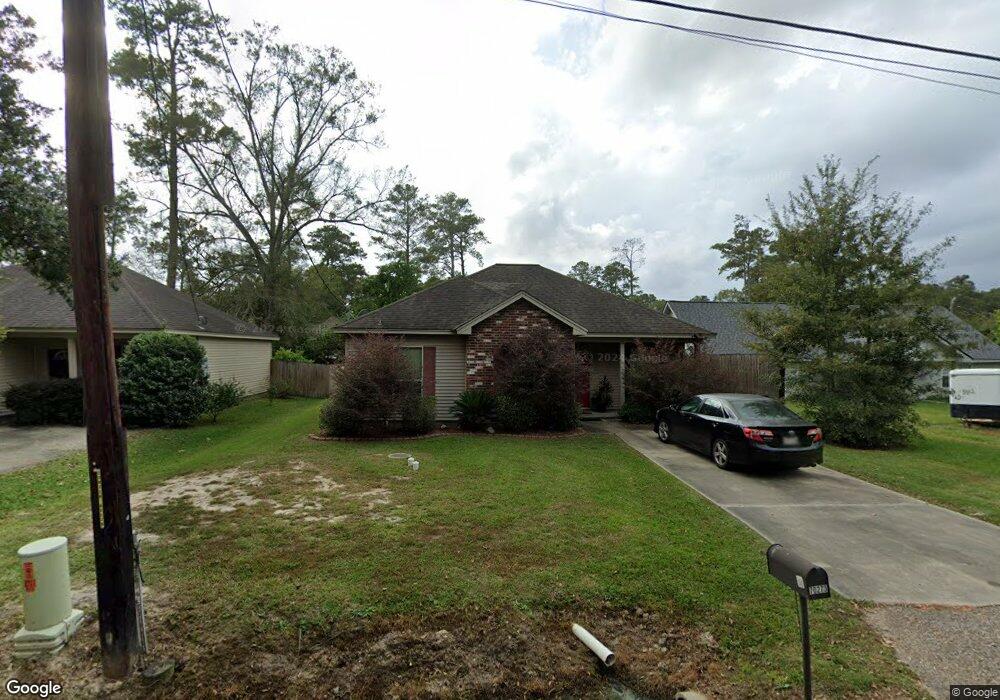
70273 I St Covington, LA 70433
Estimated Value: $186,865 - $200,000
3
Beds
2
Baths
1,150
Sq Ft
$169/Sq Ft
Est. Value
About This Home
This home is located at 70273 I St, Covington, LA 70433 and is currently estimated at $193,966, approximately $168 per square foot. 70273 I St is a home located in St. Tammany Parish with nearby schools including E. E. Lyon Elementary School, Pine View Middle School, and Fontainebleau Junior High School.
Ownership History
Date
Name
Owned For
Owner Type
Purchase Details
Closed on
Jun 13, 2024
Sold by
Bayou Equity Investments Llc
Bought by
Strain Grady
Current Estimated Value
Home Financials for this Owner
Home Financials are based on the most recent Mortgage that was taken out on this home.
Original Mortgage
$172,000
Outstanding Balance
$168,913
Interest Rate
7.09%
Mortgage Type
New Conventional
Estimated Equity
$25,053
Purchase Details
Closed on
May 26, 2020
Sold by
Strain Grady Leslie and Phillips Amber Skye
Bought by
Bayou Equity Investents Llc
Home Financials for this Owner
Home Financials are based on the most recent Mortgage that was taken out on this home.
Original Mortgage
$108,750
Interest Rate
3.2%
Mortgage Type
Commercial
Purchase Details
Closed on
Jul 30, 2014
Sold by
St Tammany Parish Sheriff
Bought by
Us Bank Na
Create a Home Valuation Report for This Property
The Home Valuation Report is an in-depth analysis detailing your home's value as well as a comparison with similar homes in the area
Home Values in the Area
Average Home Value in this Area
Purchase History
| Date | Buyer | Sale Price | Title Company |
|---|---|---|---|
| Strain Grady | -- | None Listed On Document | |
| Bayou Equity Investents Llc | -- | None Available | |
| Us Bank Na | $192,054 | -- |
Source: Public Records
Mortgage History
| Date | Status | Borrower | Loan Amount |
|---|---|---|---|
| Open | Strain Grady | $172,000 | |
| Previous Owner | Bayou Equity Investents Llc | $108,750 |
Source: Public Records
Tax History
| Year | Tax Paid | Tax Assessment Tax Assessment Total Assessment is a certain percentage of the fair market value that is determined by local assessors to be the total taxable value of land and additions on the property. | Land | Improvement |
|---|---|---|---|---|
| 2025 | $1,633 | $13,729 | $2,500 | $11,229 |
| 2024 | $1,633 | $13,729 | $2,500 | $11,229 |
| 2023 | $1,694 | $11,555 | $2,500 | $9,055 |
| 2022 | $151,198 | $11,555 | $2,500 | $9,055 |
| 2021 | $1,509 | $11,555 | $2,500 | $9,055 |
| 2020 | $529 | $11,555 | $2,500 | $9,055 |
| 2019 | $1,619 | $12,330 | $1,777 | $10,553 |
| 2018 | $1,626 | $12,330 | $1,777 | $10,553 |
| 2017 | $1,638 | $12,330 | $1,777 | $10,553 |
| 2016 | $1,645 | $12,330 | $1,777 | $10,553 |
| 2015 | $605 | $11,799 | $1,700 | $10,099 |
| 2014 | $600 | $11,799 | $1,700 | $10,099 |
| 2013 | -- | $11,799 | $1,700 | $10,099 |
Source: Public Records
Map
Nearby Homes
Your Personal Tour Guide
Ask me questions while you tour the home.