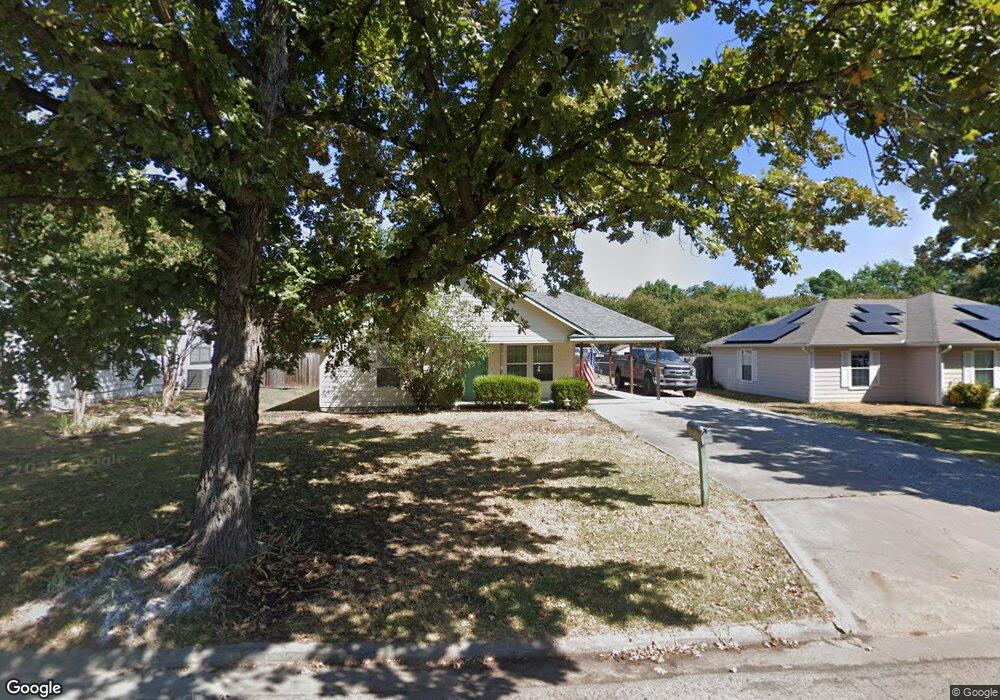
703 E 12th St Bonham, TX 75418
Estimated Value: $173,205 - $198,000
3
Beds
2
Baths
1,112
Sq Ft
$168/Sq Ft
Est. Value
About This Home
This home is located at 703 E 12th St, Bonham, TX 75418 and is currently estimated at $186,301, approximately $167 per square foot. 703 E 12th St is a home located in Fannin County with nearby schools including Evans Elementary School, Finley-Oates Elementary School, and LH Rather Jr High School.
Ownership History
Date
Name
Owned For
Owner Type
Purchase Details
Closed on
Apr 21, 2025
Sold by
First Congregational Methodist Church
Bought by
Alexander Philip S
Current Estimated Value
Home Financials for this Owner
Home Financials are based on the most recent Mortgage that was taken out on this home.
Original Mortgage
$100,395
Outstanding Balance
$99,857
Interest Rate
6.63%
Mortgage Type
New Conventional
Estimated Equity
$86,444
Purchase Details
Closed on
Oct 7, 2005
Sold by
Rater Mark A
Bought by
Toledo Marta
Create a Home Valuation Report for This Property
The Home Valuation Report is an in-depth analysis detailing your home's value as well as a comparison with similar homes in the area
Purchase History
| Date | Buyer | Sale Price | Title Company |
|---|---|---|---|
| Alexander Philip S | -- | Main Street Title | |
| Toledo Marta | -- | Cole Title Co |
Source: Public Records
Mortgage History
| Date | Status | Borrower | Loan Amount |
|---|---|---|---|
| Open | Alexander Philip S | $100,395 |
Source: Public Records
Tax History
| Year | Tax Paid | Tax Assessment Tax Assessment Total Assessment is a certain percentage of the fair market value that is determined by local assessors to be the total taxable value of land and additions on the property. | Land | Improvement |
|---|---|---|---|---|
| 2025 | $3,522 | $181,590 | $41,830 | $139,760 |
| 2024 | $36 | $183,810 | $40,510 | $143,300 |
| 2023 | $3,401 | $172,460 | $33,780 | $138,680 |
| 2022 | $3,510 | $159,590 | $24,060 | $135,530 |
| 2021 | $3,149 | $124,600 | $11,900 | $112,700 |
| 2020 | $2,878 | $112,580 | $8,930 | $103,650 |
| 2019 | $2,891 | $108,790 | $6,650 | $102,140 |
| 2018 | $2,399 | $90,400 | $6,650 | $83,750 |
| 2017 | $2,080 | $81,390 | $6,480 | $74,910 |
| 2016 | $1,995 | $78,070 | $6,480 | $71,590 |
| 2015 | -- | $75,310 | $6,300 | $69,010 |
| 2014 | -- | $73,590 | $6,210 | $67,380 |
Source: Public Records
Map
Nearby Homes
Your Personal Tour Guide
Ask me questions while you tour the home.