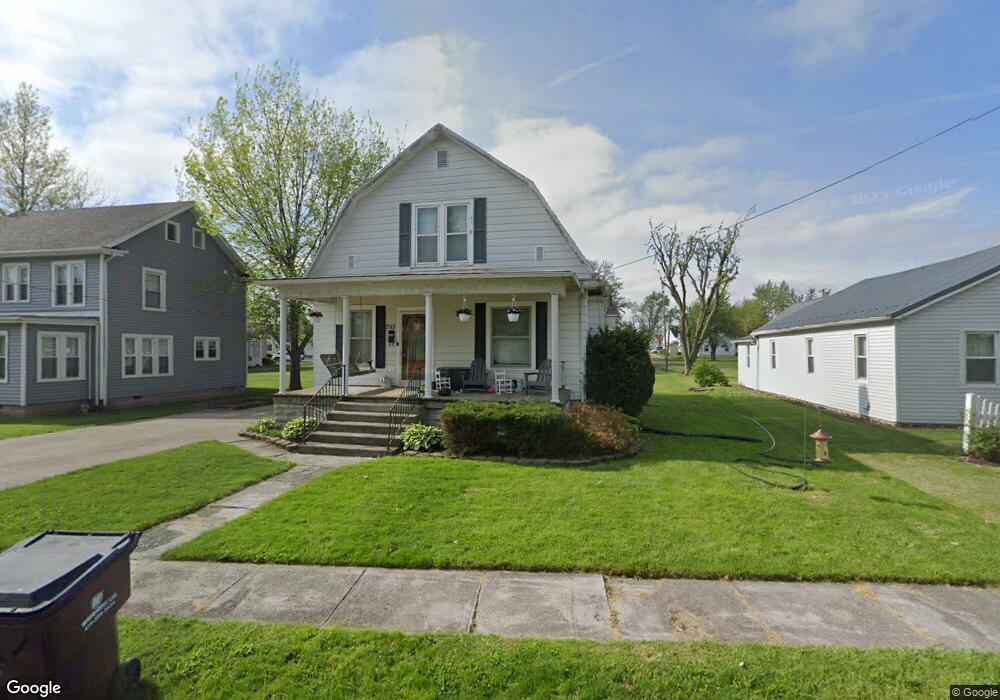
703 E 4th St Delphos, OH 45833
Estimated Value: $132,468 - $153,000
2
Beds
1
Bath
1,512
Sq Ft
$96/Sq Ft
Est. Value
About This Home
This home is located at 703 E 4th St, Delphos, OH 45833 and is currently estimated at $145,367, approximately $96 per square foot. 703 E 4th St is a home located in Allen County with nearby schools including Delphos St. John's High School and Delphos St. John's Elementary School.
Ownership History
Date
Name
Owned For
Owner Type
Purchase Details
Closed on
Aug 21, 2007
Sold by
Gallmeier Shane M and Gallmeier Brenda C
Bought by
Gallmeier Travis J and Gallmeier Kristy L
Current Estimated Value
Home Financials for this Owner
Home Financials are based on the most recent Mortgage that was taken out on this home.
Original Mortgage
$63,600
Outstanding Balance
$25,233
Interest Rate
6.72%
Mortgage Type
Future Advance Clause Open End Mortgage
Estimated Equity
$120,134
Purchase Details
Closed on
Sep 25, 1991
Bought by
Gallmeier Joseph William
Create a Home Valuation Report for This Property
The Home Valuation Report is an in-depth analysis detailing your home's value as well as a comparison with similar homes in the area
Home Values in the Area
Average Home Value in this Area
Purchase History
| Date | Buyer | Sale Price | Title Company |
|---|---|---|---|
| Gallmeier Travis J | $79,500 | None Available | |
| Gallmeier Joseph William | $44,500 | -- |
Source: Public Records
Mortgage History
| Date | Status | Borrower | Loan Amount |
|---|---|---|---|
| Open | Gallmeier Travis J | $63,600 |
Source: Public Records
Tax History
| Year | Tax Paid | Tax Assessment Tax Assessment Total Assessment is a certain percentage of the fair market value that is determined by local assessors to be the total taxable value of land and additions on the property. | Land | Improvement |
|---|---|---|---|---|
| 2024 | $1,154 | $37,210 | $6,620 | $30,590 |
| 2023 | $911 | $27,760 | $4,940 | $22,820 |
| 2022 | $933 | $27,760 | $4,940 | $22,820 |
| 2021 | $940 | $27,760 | $4,940 | $22,820 |
| 2020 | $794 | $24,710 | $4,690 | $20,020 |
| 2019 | $794 | $24,710 | $4,690 | $20,020 |
| 2018 | $808 | $24,710 | $4,690 | $20,020 |
| 2017 | $748 | $22,890 | $4,690 | $18,200 |
| 2016 | $762 | $22,890 | $4,690 | $18,200 |
| 2015 | $756 | $22,890 | $4,690 | $18,200 |
| 2014 | $756 | $22,860 | $4,520 | $18,340 |
| 2013 | $761 | $22,860 | $4,520 | $18,340 |
Source: Public Records
Map
Nearby Homes
- 821 E 3rd St
- 628 N Pierce St
- 201 E 5th St
- 610 N Washington St
- 702 N Main St
- 629 N Main St
- 221 S Main St
- 483 S Franklin St
- 424 S Canal St
- 1000 Colettas Way
- 709 W 4th St
- 537 / 539 Toomey
- 827 S Washington St
- 6800 N Defiance Trail
- 8448 Elida Rd
- 3755 Grubb Rd N
- 112 W Railroad St
- 608 N Adams St
- 0 N Conant Rd
- 19195 State Rd
Your Personal Tour Guide
Ask me questions while you tour the home.