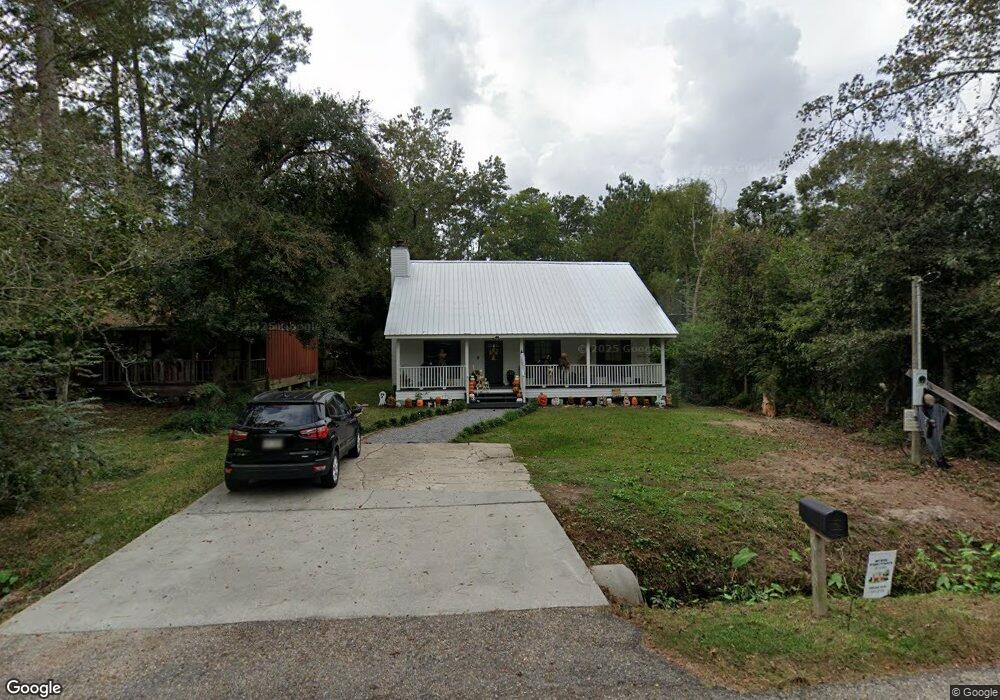
70443 L St Covington, LA 70433
Estimated Value: $185,810 - $209,000
3
Beds
2
Baths
1,280
Sq Ft
$157/Sq Ft
Est. Value
About This Home
This home is located at 70443 L St, Covington, LA 70433 and is currently estimated at $200,703, approximately $156 per square foot. 70443 L St is a home located in St. Tammany Parish with nearby schools including E. E. Lyon Elementary School, Pine View Middle School, and Fontainebleau Junior High School.
Ownership History
Date
Name
Owned For
Owner Type
Purchase Details
Closed on
Feb 11, 2021
Sold by
Barden & Demelo Invt Llc
Bought by
Smith Therisa Norman
Current Estimated Value
Home Financials for this Owner
Home Financials are based on the most recent Mortgage that was taken out on this home.
Original Mortgage
$176,739
Outstanding Balance
$156,332
Interest Rate
2.6%
Mortgage Type
FHA
Estimated Equity
$44,371
Purchase Details
Closed on
Jun 12, 2020
Sold by
Southern Star Enterprises Llc
Bought by
Barden & Demelo Invst Llc
Create a Home Valuation Report for This Property
The Home Valuation Report is an in-depth analysis detailing your home's value as well as a comparison with similar homes in the area
Home Values in the Area
Average Home Value in this Area
Purchase History
| Date | Buyer | Sale Price | Title Company |
|---|---|---|---|
| Smith Therisa Norman | $180,000 | None Available | |
| Barden & Demelo Invst Llc | $49,900 | None Available | |
| Southern Star Enterprises Llc | $35,000 | None Available |
Source: Public Records
Mortgage History
| Date | Status | Borrower | Loan Amount |
|---|---|---|---|
| Open | Smith Therisa Norman | $176,739 |
Source: Public Records
Tax History
| Year | Tax Paid | Tax Assessment Tax Assessment Total Assessment is a certain percentage of the fair market value that is determined by local assessors to be the total taxable value of land and additions on the property. | Land | Improvement |
|---|---|---|---|---|
| 2025 | $1,594 | $13,126 | $2,500 | $10,626 |
| 2024 | $1,594 | $13,126 | $2,500 | $10,626 |
| 2023 | $1,652 | $9,940 | $2,500 | $7,440 |
| 2022 | $133,227 | $9,940 | $2,500 | $7,440 |
| 2021 | $1,330 | $9,940 | $2,500 | $7,440 |
| 2020 | $326 | $9,940 | $2,500 | $7,440 |
| 2019 | $1,176 | $9,018 | $2,664 | $6,354 |
| 2018 | $1,179 | $9,018 | $2,664 | $6,354 |
| 2017 | $1,188 | $9,018 | $2,664 | $6,354 |
| 2016 | $1,193 | $9,018 | $2,664 | $6,354 |
| 2015 | $163 | $8,630 | $2,550 | $6,080 |
| 2014 | $162 | $8,630 | $2,550 | $6,080 |
| 2013 | -- | $8,630 | $2,550 | $6,080 |
Source: Public Records
Map
Nearby Homes
Your Personal Tour Guide
Ask me questions while you tour the home.