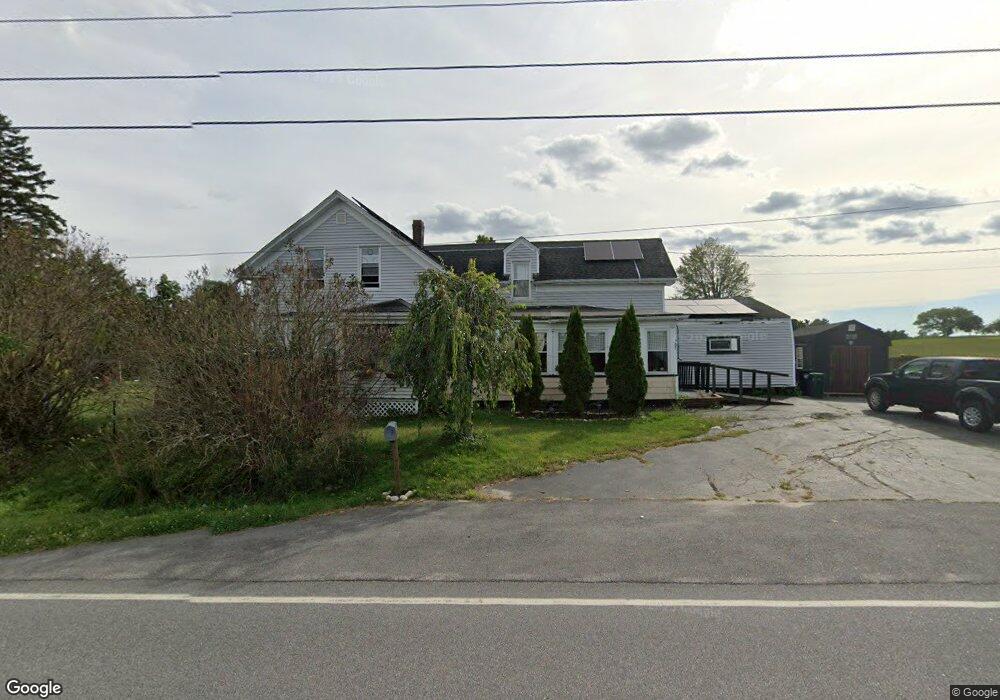
707 South St Biddeford, ME 04005
North Biddeford NeighborhoodEstimated Value: $399,047 - $606,000
5
Beds
1
Bath
2,131
Sq Ft
$244/Sq Ft
Est. Value
About This Home
This home is located at 707 South St, Biddeford, ME 04005 and is currently estimated at $520,012, approximately $244 per square foot. 707 South St is a home located in York County with nearby schools including John F Kennedy Memorial School, Biddeford Primary School, and Biddeford Intermediate School.
Ownership History
Date
Name
Owned For
Owner Type
Purchase Details
Closed on
Jun 5, 2009
Sold by
Clair Michael S
Bought by
Desjardins Meagan
Current Estimated Value
Home Financials for this Owner
Home Financials are based on the most recent Mortgage that was taken out on this home.
Original Mortgage
$127,500
Outstanding Balance
$79,073
Interest Rate
4.83%
Mortgage Type
Unknown
Estimated Equity
$440,939
Purchase Details
Closed on
Sep 12, 2008
Sold by
Desjardins Gerard F
Bought by
Clair Michael S
Create a Home Valuation Report for This Property
The Home Valuation Report is an in-depth analysis detailing your home's value as well as a comparison with similar homes in the area
Home Values in the Area
Average Home Value in this Area
Purchase History
| Date | Buyer | Sale Price | Title Company |
|---|---|---|---|
| Desjardins Meagan | -- | -- | |
| Clair Michael S | -- | -- |
Source: Public Records
Mortgage History
| Date | Status | Borrower | Loan Amount |
|---|---|---|---|
| Open | Clair Michael S | $127,500 |
Source: Public Records
Tax History
| Year | Tax Paid | Tax Assessment Tax Assessment Total Assessment is a certain percentage of the fair market value that is determined by local assessors to be the total taxable value of land and additions on the property. | Land | Improvement |
|---|---|---|---|---|
| 2025 | $3,653 | $244,500 | $161,000 | $83,500 |
| 2024 | $3,684 | $259,100 | $161,000 | $98,100 |
| 2023 | $3,359 | $256,000 | $157,900 | $98,100 |
| 2022 | $3,284 | $200,100 | $69,400 | $130,700 |
| 2021 | $3,101 | $170,100 | $58,900 | $111,200 |
| 2020 | $3,062 | $152,700 | $49,600 | $103,100 |
| 2019 | $3,051 | $152,700 | $49,600 | $103,100 |
| 2018 | $4,957 | $152,700 | $49,600 | $103,100 |
| 2017 | $2,414 | $144,700 | $49,600 | $95,100 |
| 2016 | $2,874 | $144,700 | $49,600 | $95,100 |
| 2015 | $2,817 | $144,700 | $49,600 | $95,100 |
| 2014 | $2,782 | $146,500 | $49,600 | $96,900 |
| 2013 | -- | $180,400 | $56,900 | $123,500 |
Source: Public Records
Map
Nearby Homes
Your Personal Tour Guide
Ask me questions while you tour the home.