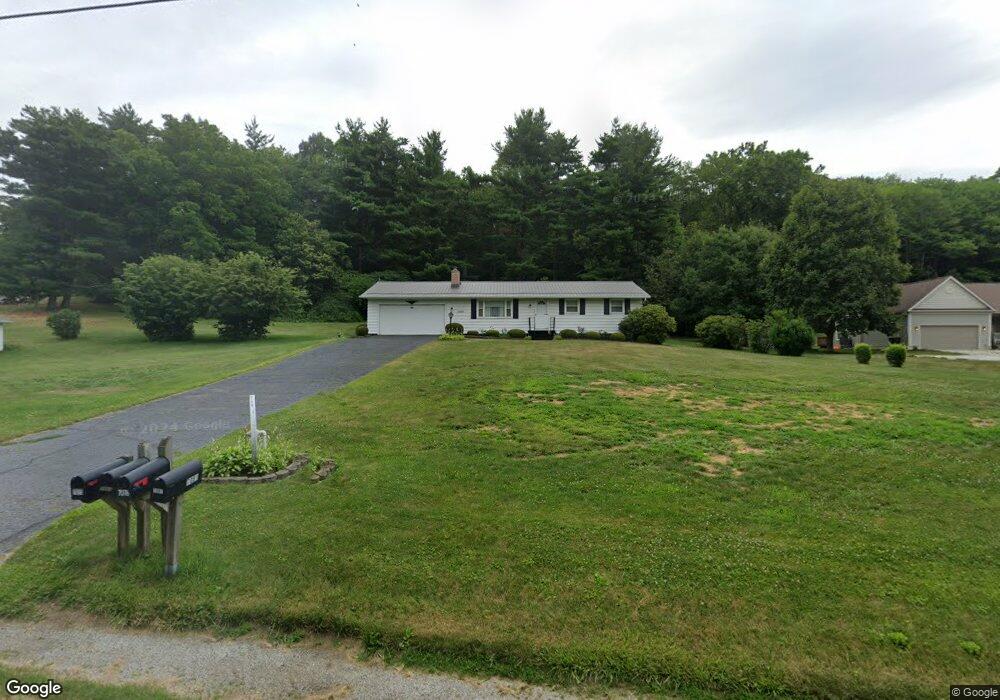
7075 Mapleton St SE East Canton, OH 44730
Estimated Value: $103,000 - $180,000
3
Beds
2
Baths
1,092
Sq Ft
$130/Sq Ft
Est. Value
About This Home
This home is located at 7075 Mapleton St SE, East Canton, OH 44730 and is currently estimated at $141,500, approximately $129 per square foot. 7075 Mapleton St SE is a home located in Stark County with nearby schools including East Canton Elementary School, East Canton Middle School, and East Canton High School.
Ownership History
Date
Name
Owned For
Owner Type
Purchase Details
Closed on
Jan 25, 2002
Sold by
Nestor Ira D and Nestor Mary P
Bought by
Nestor Ira D and Nestor Mary P
Current Estimated Value
Purchase Details
Closed on
Feb 3, 1992
Create a Home Valuation Report for This Property
The Home Valuation Report is an in-depth analysis detailing your home's value as well as a comparison with similar homes in the area
Purchase History
| Date | Buyer | Sale Price | Title Company |
|---|---|---|---|
| Nestor Ira D | -- | -- | |
| -- | -- | -- |
Source: Public Records
Tax History
| Year | Tax Paid | Tax Assessment Tax Assessment Total Assessment is a certain percentage of the fair market value that is determined by local assessors to be the total taxable value of land and additions on the property. | Land | Improvement |
|---|---|---|---|---|
| 2025 | -- | $2,910 | $1,190 | $1,720 |
| 2024 | -- | $2,910 | $1,190 | $1,720 |
| 2023 | $92 | $2,350 | $630 | $1,720 |
| 2022 | $94 | $2,350 | $630 | $1,720 |
| 2021 | $95 | $2,350 | $630 | $1,720 |
| 2020 | $96 | $2,180 | $600 | $1,580 |
| 2019 | $95 | $2,180 | $600 | $1,580 |
Source: Public Records
Map
Nearby Homes
- 8155 Westfall St SE
- 0 Lincoln St SE Unit 5157308
- 0 Lincoln St SE Unit 5157344
- 226 Liberty St E
- 403 Nassau St W
- 137 Noble St W
- 231 Cedar St N
- 0000 Ravenna Chapel Ave SE
- 318 Wood St N
- 8114 Lisbon St E
- 6805 Waynesburg Dr SE
- 10400 Lincoln St SE
- 362 Jettie Ave NE
- 1945 Fairbrook Ave NE
- 7091 Bluebird Rd NW Unit 2W
- 2511 Sherr Ave SE
- 2425 Miday Ave NE
- 4943 Martin Dr SE
- 324 Charlotte Ave SE
- 6323 Georgetown St
- 7075 Mapleton St SE
- 7081 Mapleton St SE
- 7050 Mapleton St SE
- 7021 Mapleton St SE
- 7020 Mapleton St SE
- 7015 Mapleton St SE
- 6990 Mapleton St SE
- 7076 Mapleton St SE
- 7225 Mapleton St SE
- 6964 Mapleton St SE
- 6866 Mapleton St SE
- 6848 Mapleton St SE
- 3214 Indian Run Ave SE
- 7282 Mapleton St SE
- 7230 Mapleton St SE
- 7345 Mapleton St SE
- 3306 Indian Run Ave SE
- 3216 Indian Run Ave SE
- 3384 Indian Run Ave SE
- 3320 Indian Run Ave SE
Your Personal Tour Guide
Ask me questions while you tour the home.