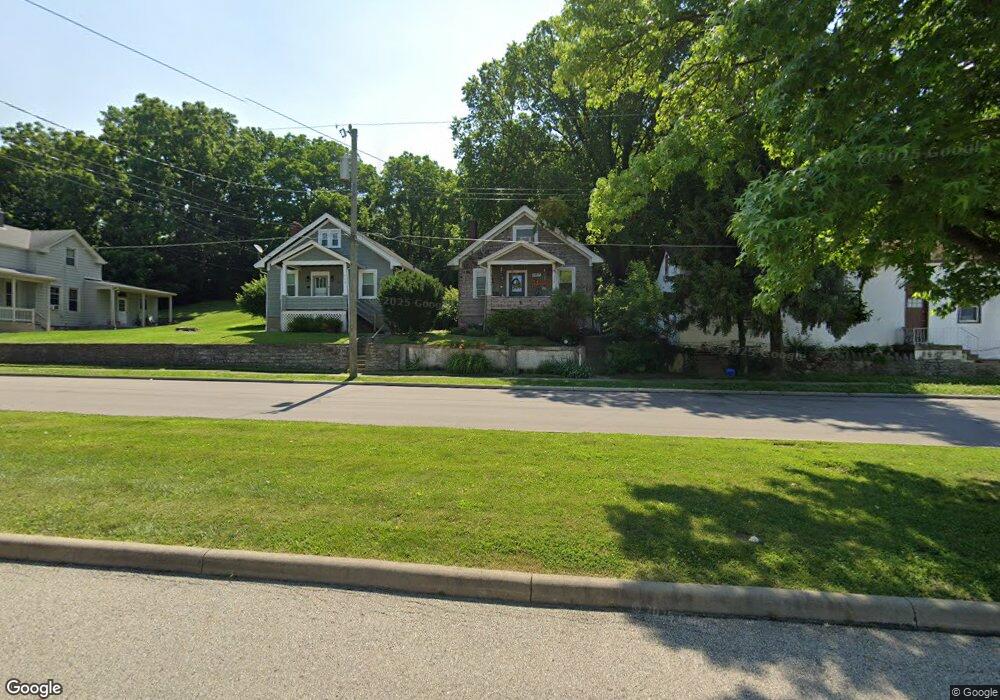
708 3rd St Cincinnati, OH 45215
Estimated Value: $125,000 - $177,000
4
Beds
1
Bath
1,066
Sq Ft
$140/Sq Ft
Est. Value
About This Home
This home is located at 708 3rd St, Cincinnati, OH 45215 and is currently estimated at $149,362, approximately $140 per square foot. 708 3rd St is a home located in Hamilton County with nearby schools including Reading Community High School, Saints Peter and Paul Academy, and Mount Notre Dame High School.
Ownership History
Date
Name
Owned For
Owner Type
Purchase Details
Closed on
May 7, 2010
Sold by
Bachtel Randy and Meredith Kimberly
Bought by
Haygood Nicole Irene
Current Estimated Value
Home Financials for this Owner
Home Financials are based on the most recent Mortgage that was taken out on this home.
Original Mortgage
$64,136
Outstanding Balance
$42,492
Interest Rate
5.13%
Mortgage Type
FHA
Estimated Equity
$106,870
Purchase Details
Closed on
Jun 5, 2006
Sold by
Blaker Russell J and Blaker Douglas A
Bought by
Luttrell Norman and Bachtel Kim
Purchase Details
Closed on
Mar 28, 2006
Sold by
Blaker Doris
Bought by
Blaker Russell J and Blaker Douglas A
Create a Home Valuation Report for This Property
The Home Valuation Report is an in-depth analysis detailing your home's value as well as a comparison with similar homes in the area
Home Values in the Area
Average Home Value in this Area
Purchase History
| Date | Buyer | Sale Price | Title Company |
|---|---|---|---|
| Haygood Nicole Irene | $65,000 | Prodigy Title Agency | |
| Luttrell Norman | -- | Cincinnati Ohio Escrow & Tit | |
| Blaker Russell J | -- | None Available |
Source: Public Records
Mortgage History
| Date | Status | Borrower | Loan Amount |
|---|---|---|---|
| Open | Haygood Nicole Irene | $64,136 |
Source: Public Records
Tax History
| Year | Tax Paid | Tax Assessment Tax Assessment Total Assessment is a certain percentage of the fair market value that is determined by local assessors to be the total taxable value of land and additions on the property. | Land | Improvement |
|---|---|---|---|---|
| 2025 | $1,382 | $26,072 | $6,465 | $19,607 |
| 2023 | $1,370 | $26,072 | $6,465 | $19,607 |
| 2022 | $1,075 | $15,852 | $5,198 | $10,654 |
| 2021 | $897 | $15,852 | $5,198 | $10,654 |
| 2020 | $907 | $15,852 | $5,198 | $10,654 |
| 2019 | $879 | $14,028 | $4,599 | $9,429 |
| 2018 | $880 | $14,028 | $4,599 | $9,429 |
| 2017 | $829 | $14,028 | $4,599 | $9,429 |
| 2016 | $1,314 | $22,296 | $4,876 | $17,420 |
| 2015 | $1,326 | $22,296 | $4,876 | $17,420 |
| 2014 | $1,160 | $22,296 | $4,876 | $17,420 |
| 2013 | $1,175 | $22,751 | $4,974 | $17,777 |
Source: Public Records
Map
Nearby Homes
Your Personal Tour Guide
Ask me questions while you tour the home.