709 Burnaby Ct Cary, NC 27519
South Durham NeighborhoodEstimated Value: $501,000 - $538,000
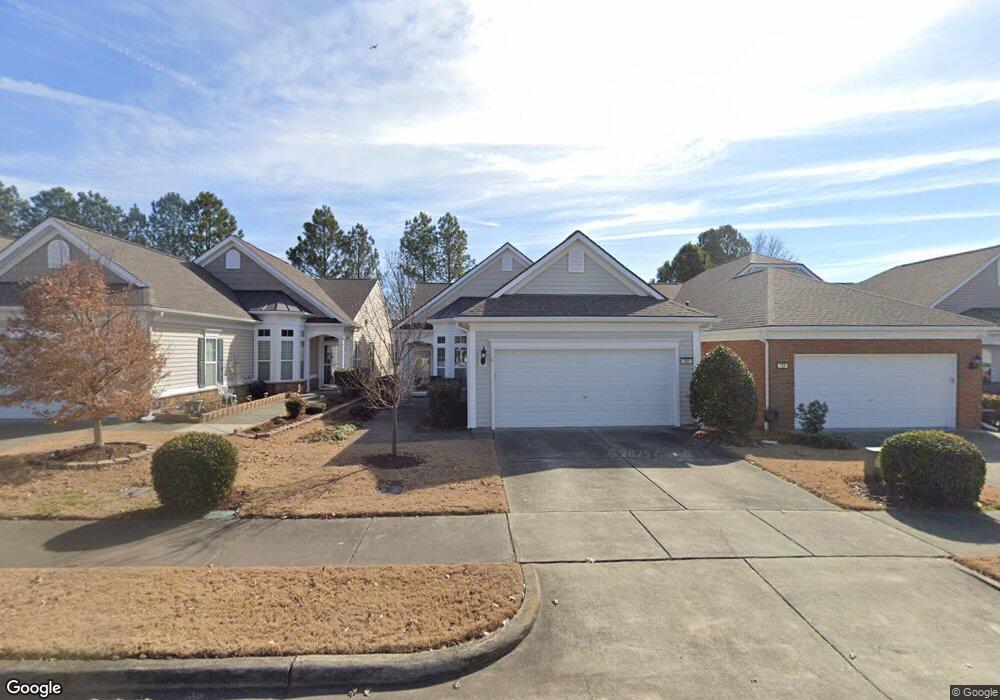
About This Home
This home is located at 709 Burnaby Ct, Cary, NC 27519 and is currently estimated at $526,365, approximately $339 per square foot. 709 Burnaby Ct is a home located in Chatham County with nearby schools including North Chatham Elementary School, Margaret B. Pollard Middle School, and Discovery Child Development Center LLC.
Ownership History
We collect this data history from publicly available records. To have your information removed, we recommend requesting removal directly through your county’s website.
Purchase Details
Home Financials for this Owner
Home Financials are based on the most recent Mortgage that was taken out on this home.Home Values in the Area
Average Home Value in this Area
Purchase History
We collect this data history from publicly available records. To have your information removed, we recommend requesting removal directly through your county’s website.
| Date | Buyer | Sale Price | Title Company |
|---|---|---|---|
| $274,000 | None Available |
Mortgage History
We collect this data history from publicly available records. To have your information removed, we recommend requesting removal directly through your county’s website.
| Date | Status | Borrower | Loan Amount |
|---|---|---|---|
| Open | $149,000 | ||
| Closed | $153,725 |
Tax History
We collect this data history from publicly available records. To have your information removed, we recommend requesting removal directly through your county’s website.
| Year | Tax Paid | Tax Assessment Tax Assessment Total Assessment is a certain percentage of the fair market value that is determined by local assessors to be the total taxable value of land and additions on the property. | Land | Improvement |
|---|---|---|---|---|
| 2025 | $4,768 | $507,215 | $87,680 | $419,535 |
| 2024 | $4,768 | $341,677 | $82,200 | $259,477 |
| 2023 | $3,588 | $341,677 | $82,200 | $259,477 |
| 2022 | $3,451 | $341,677 | $82,200 | $259,477 |
| 2021 | $3,451 | $341,677 | $82,200 | $259,477 |
| 2020 | $2,922 | $286,465 | $58,500 | $227,965 |
| 2019 | $2,922 | $286,465 | $58,500 | $227,965 |
| 2018 | $2,802 | $286,465 | $58,500 | $227,965 |
| 2017 | $2,802 | $286,465 | $58,500 | $227,965 |
| 2016 | $2,426 | $246,600 | $50,000 | $196,600 |
| 2015 | $2,446 | $246,600 | $50,000 | $196,600 |
| 2014 | -- | $246,600 | $50,000 | $196,600 |
| 2013 | -- | $246,600 | $50,000 | $196,600 |
Map
- 304 Dowington Ln
- 313 Beckingham Loop
- 1206 Ventnor Place
- 610 Balsam Fir Dr
- 3114 Bluff Oak Dr
- 235 Beckingham Loop
- 7628 McCrimmon Pkwy
- 1050 Residents Club Dr
- 107 Repton Ct
- 845 Bristol Bridge Dr
- 1903 Whirlaway Ct
- 113 Longchamp Ln
- 210 Lone Star Way
- 204 Lone Star Way
- 103 Longchamp Ln
- 2016 Waterbush Cove Ct
- 1113 Brookhill Way
- 1241 Canyon Shadows Ct
- 605 Finnbar Dr
- 715 Finnbar Dr
- 707 Burnaby Ct
- 711 Burnaby Ct
- 705 Burnaby Ct
- 713 Burnaby Ct
- 703 Burnaby Ct
- 715 Burnaby Ct
- 701 Burnaby Ct
- 102 Beckingham Loop
- 708 Burnaby Ct
- 706 Burnaby Ct
- 717 Burnaby Ct
- 704 Burnaby Ct
- 104 Beckingham Loop
- 702 Burnaby Ct
- 716 Burnaby Ct
- 719 Burnaby Ct
- 700 Burnaby Ct
- 106 Beckingham Loop
- 721 Burnaby Ct
- 304 Easton Grey Loop
Ask me questions while you tour the home.