709 Jackson St Delphos, OH 45833
Estimated Value: $89,000 - $114,000
About This Home
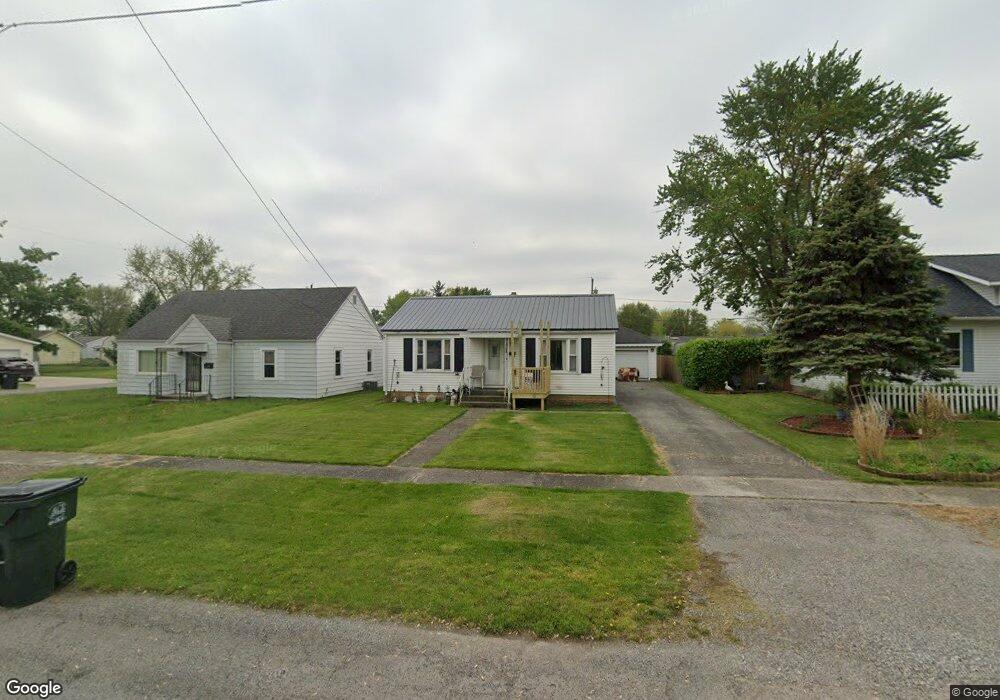
This home is located at 709 Jackson St, Delphos, OH 45833 and is currently estimated at $100,165, approximately $130 per square foot. 709 Jackson St is a home located in Allen County with nearby schools including Delphos St. John's High School and Delphos St. John's Elementary School.
Ownership History
We collect this data history from publicly available records. To have your information removed, we recommend requesting removal directly through your county’s website.
Purchase Details
Purchase Details
Purchase Details
Purchase Details
Purchase Details
Home Values in the Area
Average Home Value in this Area
Purchase History
We collect this data history from publicly available records. To have your information removed, we recommend requesting removal directly through your county’s website.
| Date | Buyer | Sale Price | Title Company |
|---|---|---|---|
| $45,000 | None Available | ||
| $45,000 | Attorney | ||
| -- | Attorney | ||
| $42,000 | -- | ||
| $35,000 | -- |
Tax History
We collect this data history from publicly available records. To have your information removed, we recommend requesting removal directly through your county’s website.
| Year | Tax Paid | Tax Assessment Tax Assessment Total Assessment is a certain percentage of the fair market value that is determined by local assessors to be the total taxable value of land and additions on the property. | Land | Improvement |
|---|---|---|---|---|
| 2025 | $849 | $26,430 | $6,060 | $20,370 |
| 2024 | $848 | $26,430 | $6,060 | $20,370 |
| 2023 | $671 | $19,710 | $4,520 | $15,190 |
| 2022 | $687 | $19,710 | $4,520 | $15,190 |
| 2021 | $693 | $19,710 | $4,520 | $15,190 |
| 2020 | $591 | $17,820 | $4,340 | $13,480 |
| 2019 | $591 | $17,820 | $4,340 | $13,480 |
| 2018 | $589 | $17,820 | $4,340 | $13,480 |
| 2017 | $560 | $16,590 | $4,340 | $12,250 |
| 2016 | $573 | $16,590 | $4,340 | $12,250 |
| 2015 | $564 | $16,590 | $4,340 | $12,250 |
| 2014 | $560 | $16,490 | $4,170 | $12,320 |
| 2013 | $566 | $16,490 | $4,170 | $12,320 |
Map
- 333 S Pierce St
- 532 E 3rd St
- 334 S Main St
- 904 E 2nd St
- 427 S Main St
- 221 S Main St
- 528 S Main St
- 742 E 4th St
- 424 S Canal St
- 201 E 5th St
- 610 N Washington St
- 509 E 8th St
- 227 W Clime St Unit Lot 59
- 504 E 8th St
- 608 Davis St
- 414 W 3rd St
- 328 W 5th St
- 622 W 2nd St
- 7110 Elida Rd
- 1400 S Clay St Unit Lot 12
- 456 E Cleveland St
- 458 E Cleveland St
- 454 E Cleveland St
- 703 Jackson St
- 629 Jackson St
- 460 E Cleveland St
- 707 Jackson St
- 448 E Cleveland St
- 623 Jackson St
- 455 E Cleveland St
- 459 E Cleveland St
- 453 E Cleveland St
- 619 Jackson St
- 719 Jackson St
- 446 E Cleveland St
- 461 E Cleveland St
- 322 Grant St
- 449 E Cleveland St
- 615 E Jackson
- 615 Jackson St
Ask me questions while you tour the home.