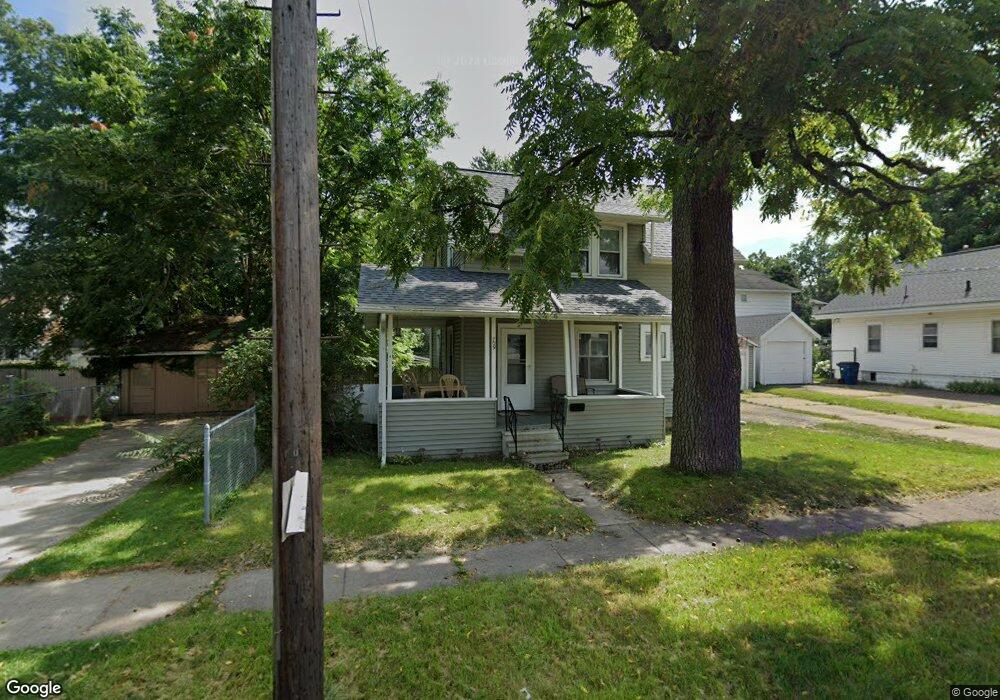
709 W North St Jackson, MI 49202
Bennett NeighborhoodEstimated Value: $90,607 - $126,000
3
Beds
1
Bath
886
Sq Ft
$120/Sq Ft
Est. Value
About This Home
This home is located at 709 W North St, Jackson, MI 49202 and is currently estimated at $106,402, approximately $120 per square foot. 709 W North St is a home located in Jackson County with nearby schools including Hunt Elementary School, Middle School at Parkside, and Jackson High School.
Ownership History
Date
Name
Owned For
Owner Type
Purchase Details
Closed on
Oct 17, 2019
Sold by
Fowle Jennifer
Bought by
Garrison Dustin J and Turner Chelsea L
Current Estimated Value
Home Financials for this Owner
Home Financials are based on the most recent Mortgage that was taken out on this home.
Original Mortgage
$51,333
Outstanding Balance
$45,198
Interest Rate
3.75%
Mortgage Type
FHA
Estimated Equity
$61,204
Purchase Details
Closed on
Mar 8, 2012
Sold by
Aeroquip Credit Union
Bought by
Fowle Jennifer
Create a Home Valuation Report for This Property
The Home Valuation Report is an in-depth analysis detailing your home's value as well as a comparison with similar homes in the area
Home Values in the Area
Average Home Value in this Area
Purchase History
| Date | Buyer | Sale Price | Title Company |
|---|---|---|---|
| Garrison Dustin J | $61,500 | None Available | |
| Fowle Jennifer | $18,000 | Midstate Title Agency Of Sou |
Source: Public Records
Mortgage History
| Date | Status | Borrower | Loan Amount |
|---|---|---|---|
| Open | Garrison Dustin J | $51,333 |
Source: Public Records
Tax History
| Year | Tax Paid | Tax Assessment Tax Assessment Total Assessment is a certain percentage of the fair market value that is determined by local assessors to be the total taxable value of land and additions on the property. | Land | Improvement |
|---|---|---|---|---|
| 2025 | $1,169 | $32,700 | $0 | $0 |
| 2024 | $10 | $30,700 | $0 | $0 |
| 2023 | $919 | $27,500 | $0 | $0 |
| 2022 | $1,072 | $24,200 | $0 | $0 |
| 2021 | $1,068 | $20,350 | $0 | $0 |
| 2020 | $1,120 | $21,250 | $0 | $0 |
| 2019 | $1,633 | $24,750 | $0 | $0 |
| 2018 | $1,557 | $24,700 | $0 | $0 |
| 2017 | $1,428 | $23,650 | $0 | $0 |
| 2016 | $1,231 | $26,500 | $26,500 | $0 |
| 2015 | $1,342 | $24,650 | $24,650 | $0 |
| 2014 | $1,342 | $22,600 | $22,600 | $0 |
| 2013 | -- | $22,600 | $22,600 | $0 |
Source: Public Records
Map
Nearby Homes
Your Personal Tour Guide
Ask me questions while you tour the home.