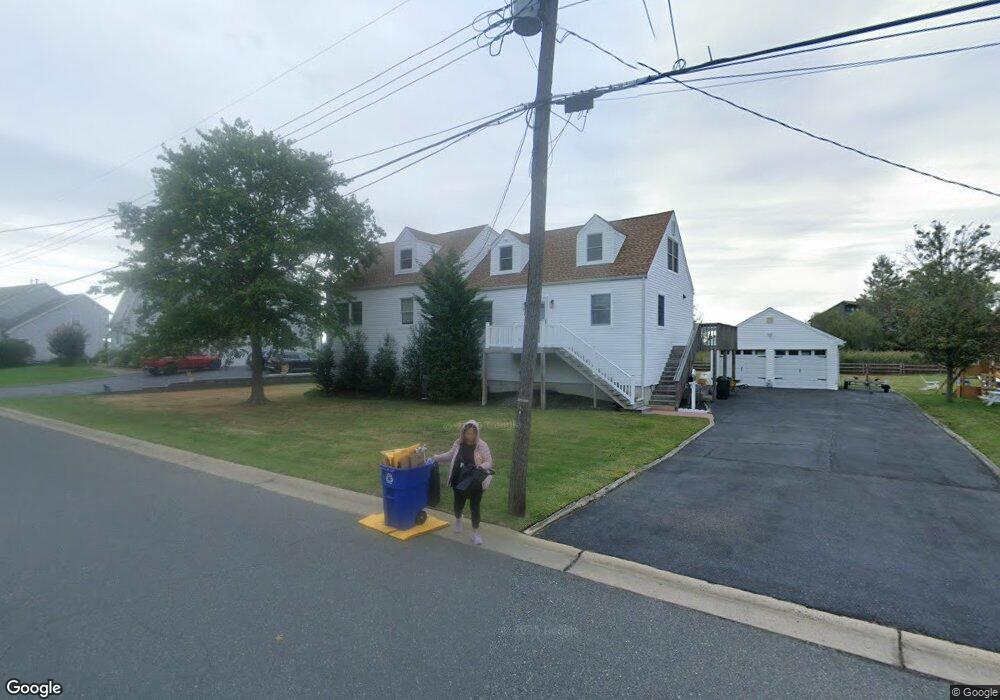
71 Cayuga Ave Oceanport, NJ 07757
Estimated Value: $873,000 - $1,347,000
About This Home
This home is located at 71 Cayuga Ave, Oceanport, NJ 07757 and is currently estimated at $1,022,892, approximately $434 per square foot. 71 Cayuga Ave is a home located in Monmouth County with nearby schools including Wolf Hill Elementary School, Maple Place Elementary and Middle School, and Shore Regional High School.
Ownership History
We collect this data history from publicly available records. To have your information removed, we recommend requesting removal directly through your county’s website.
Purchase Details
Home Financials for this Owner
Home Financials are based on the most recent Mortgage that was taken out on this home.Purchase Details
Home Values in the Area
Average Home Value in this Area
Purchase History
We collect this data history from publicly available records. To have your information removed, we recommend requesting removal directly through your county’s website.
| Date | Buyer | Sale Price | Title Company |
|---|---|---|---|
| $500,000 | Foundation Title | ||
| $500,000 | Foundation Title | ||
| $600,000 | None Available |
Mortgage History
We collect this data history from publicly available records. To have your information removed, we recommend requesting removal directly through your county’s website.
| Date | Status | Borrower | Loan Amount |
|---|---|---|---|
| Open | $475,000 | ||
| Closed | $475,000 |
Tax History
We collect this data history from publicly available records. To have your information removed, we recommend requesting removal directly through your county’s website.
| Year | Tax Paid | Tax Assessment Tax Assessment Total Assessment is a certain percentage of the fair market value that is determined by local assessors to be the total taxable value of land and additions on the property. | Land | Improvement |
|---|---|---|---|---|
| 2025 | $10,185 | $686,300 | $404,000 | $282,300 |
| 2024 | $10,475 | $645,000 | $375,000 | $270,000 |
| 2023 | $10,475 | $629,500 | $373,000 | $256,500 |
| 2022 | $10,670 | $572,600 | $358,000 | $214,600 |
| 2021 | $10,670 | $560,100 | $356,000 | $204,100 |
| 2020 | $10,138 | $554,600 | $354,000 | $200,600 |
| 2019 | $9,862 | $547,600 | $354,000 | $193,600 |
| 2018 | $9,755 | $545,300 | $354,000 | $191,300 |
| 2017 | $10,121 | $469,200 | $276,000 | $193,200 |
| 2016 | $10,064 | $469,600 | $280,000 | $189,600 |
| 2015 | $9,638 | $464,700 | $280,000 | $184,700 |
| 2014 | $8,481 | $414,700 | $300,000 | $114,700 |
Map
- 229 Comanche Dr
- 68 Gooseneck Point Rd
- 8 Pocahontas Ave
- 127 Sagamore Ave
- 79 Iroquois Ave
- 5 Marine Place
- 1 Foggia Way
- 580 Patten Ave Unit 88
- 10 Seawinds Way
- 253 Arnold Ave
- 68 Seneca Place
- 10 Asbury Ave
- 4 Bayview Ct
- 25 Meadow Ave Unit 51
- 25 Meadow Ave Unit 39
- 151 Kingsley St
- 600 Little Silver Point Rd
- 15 Sea Girt Ave
- 1 Jackson Ct
- 585 Little Silver Point Rd
Ask me questions while you tour the home.