71 Cedarhill Rd Holbrook, MA 02343
Estimated Value: $703,022 - $766,000
About This Home
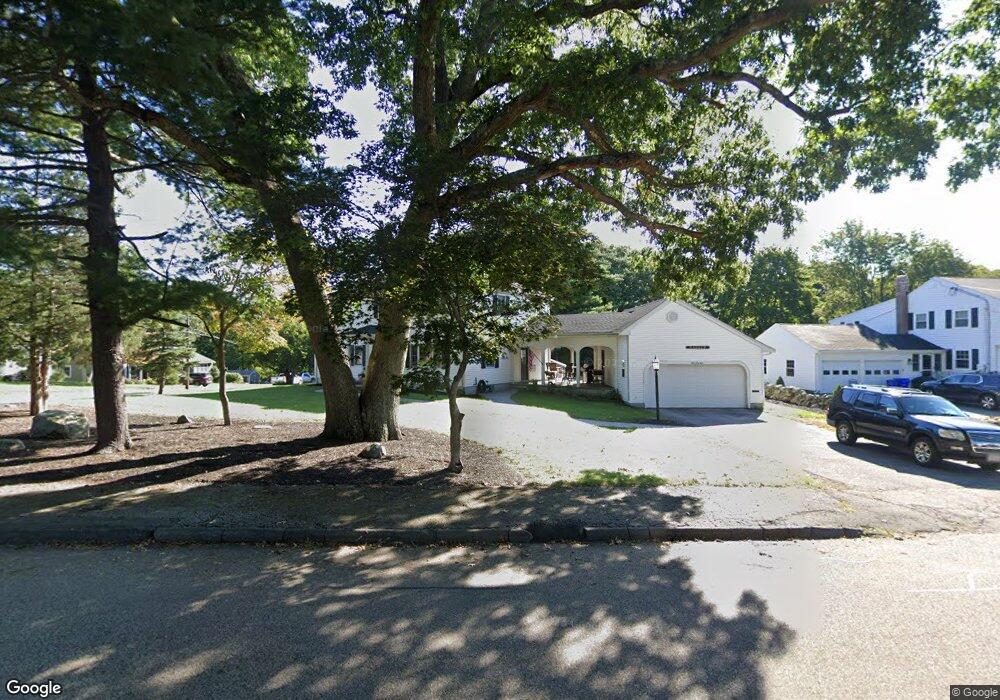
This home is located at 71 Cedarhill Rd, Holbrook, MA 02343 and is currently estimated at $730,256, approximately $283 per square foot. 71 Cedarhill Rd is a home located in Norfolk County with nearby schools including John F. Kennedy Elementary School, Holbrook Middle High School, and Boston Higashi School.
Ownership History
We collect this data history from publicly available records. To have your information removed, we recommend requesting removal directly through your county’s website.
Purchase Details
Home Financials for this Owner
Home Financials are based on the most recent Mortgage that was taken out on this home.Home Values in the Area
Average Home Value in this Area
Purchase History
We collect this data history from publicly available records. To have your information removed, we recommend requesting removal directly through your county’s website.
| Date | Buyer | Sale Price | Title Company |
|---|---|---|---|
| $132,853 | -- |
Mortgage History
We collect this data history from publicly available records. To have your information removed, we recommend requesting removal directly through your county’s website.
| Date | Status | Borrower | Loan Amount |
|---|---|---|---|
| Open | $120,000 | ||
| Closed | $124,000 |
Tax History
We collect this data history from publicly available records. To have your information removed, we recommend requesting removal directly through your county’s website.
| Year | Tax Paid | Tax Assessment Tax Assessment Total Assessment is a certain percentage of the fair market value that is determined by local assessors to be the total taxable value of land and additions on the property. | Land | Improvement |
|---|---|---|---|---|
| 2025 | $82 | $623,600 | $261,400 | $362,200 |
| 2024 | $7,982 | $593,900 | $237,500 | $356,400 |
| 2023 | $8,125 | $528,300 | $216,000 | $312,300 |
| 2022 | $7,661 | $464,600 | $187,800 | $276,800 |
| 2021 | $7,610 | $441,900 | $175,600 | $266,300 |
| 2020 | $7,848 | $427,200 | $167,200 | $260,000 |
| 2019 | $7,751 | $398,300 | $149,100 | $249,200 |
| 2018 | $7,633 | $369,300 | $126,400 | $242,900 |
| 2017 | $7,545 | $361,000 | $126,400 | $234,600 |
| 2016 | $7,249 | $369,100 | $140,800 | $228,300 |
| 2015 | $6,644 | $348,200 | $132,400 | $215,800 |
| 2014 | $6,153 | $327,800 | $120,400 | $207,400 |
Map
- 47 Mount Pleasant Ave
- 5 Clarendon Cir
- 45 Maplewood Ave
- 1 Birchwood Rd
- 25 Lakeview Ave
- 49 Pleasant St
- 148 N Franklin St
- 14 Elm Ave
- 249 Mill St
- 43 Plymouth St
- 266 N Franklin St Unit 266A
- 346 South St
- 22 Milton Terrace
- 42 Fern Rd
- 19 Lind Terrace
- 158 Union St
- 89 Fernandez Cir
- 153 Union St
- 4 Ell Rd
- 27 Morgan Rd
- 67 Cedarhill Rd
- 78 Mount Pleasant Ave
- 55 Mount Pleasant Ave
- 59 Mount Pleasant Ave
- 56 Mount Pleasant Ave
- 63 Cedarhill Rd
- 63 Cedarhill Rd Unit 1
- 63 Mount Pleasant Ave
- 4 Maplewood Ave
- 51 Mount Pleasant Ave
- 29 Hillside Ave
- 134 Roberts Ave
- 52 Mount Pleasant Ave
- 136 Roberts Ave
- 132 Roberts Ave
- 56 Cedarhill Rd
- 33 Hillside Ave
- 77 Westdale Rd
- 25 Hillside Ave
- 130 Roberts Ave
Ask me questions while you tour the home.