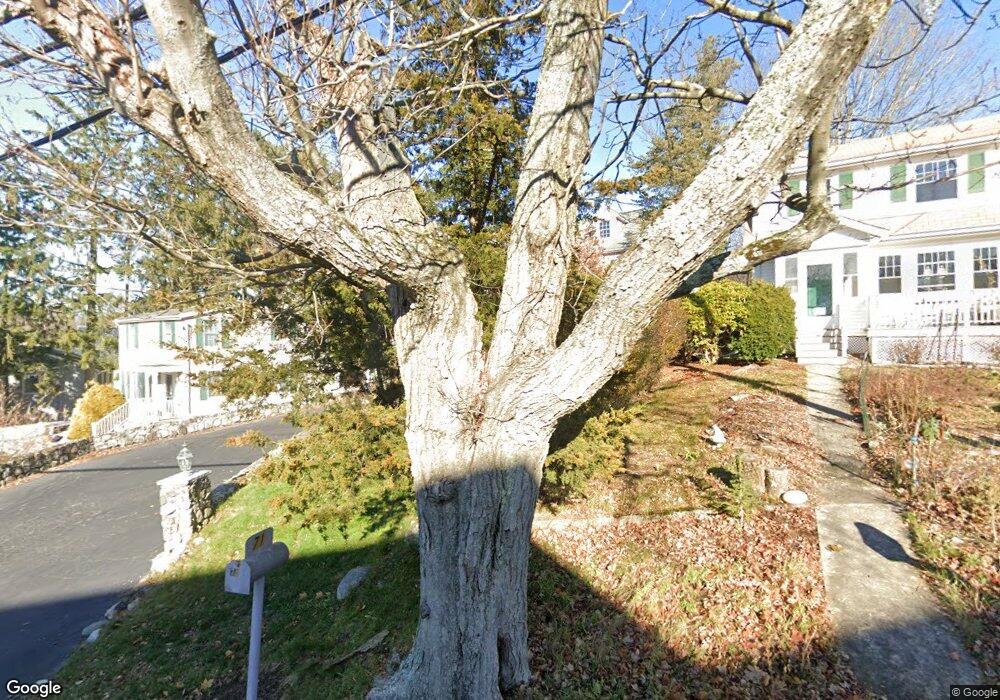
71 Dunster Ln Winchester, MA 01890
West Side NeighborhoodEstimated Value: $1,798,422 - $2,362,000
5
Beds
3
Baths
3,900
Sq Ft
$520/Sq Ft
Est. Value
About This Home
This home is located at 71 Dunster Ln, Winchester, MA 01890 and is currently estimated at $2,028,856, approximately $520 per square foot. 71 Dunster Ln is a home located in Middlesex County with nearby schools including Vinson-Owen Elementary School, McCall Middle School, and Winchester High School.
Ownership History
Date
Name
Owned For
Owner Type
Purchase Details
Closed on
Jul 20, 2016
Sold by
Mestechkin Russell M and Mestechkin Tamara
Bought by
Mestechkin Russell M and Mestechkin Tamara
Current Estimated Value
Purchase Details
Closed on
Jan 10, 2005
Sold by
Davolio Michael E
Bought by
Mestechkin Russell M and Mestechkin Tamara
Home Financials for this Owner
Home Financials are based on the most recent Mortgage that was taken out on this home.
Original Mortgage
$300,000
Interest Rate
5.75%
Mortgage Type
Purchase Money Mortgage
Create a Home Valuation Report for This Property
The Home Valuation Report is an in-depth analysis detailing your home's value as well as a comparison with similar homes in the area
Home Values in the Area
Average Home Value in this Area
Purchase History
| Date | Buyer | Sale Price | Title Company |
|---|---|---|---|
| Mestechkin Russell M | -- | -- | |
| Mestechkin Russell M | $809,500 | -- |
Source: Public Records
Mortgage History
| Date | Status | Borrower | Loan Amount |
|---|---|---|---|
| Previous Owner | Mestechkin Russell M | $300,000 |
Source: Public Records
Tax History
| Year | Tax Paid | Tax Assessment Tax Assessment Total Assessment is a certain percentage of the fair market value that is determined by local assessors to be the total taxable value of land and additions on the property. | Land | Improvement |
|---|---|---|---|---|
| 2025 | $160 | $1,443,000 | $617,800 | $825,200 |
| 2024 | $15,640 | $1,380,400 | $617,800 | $762,600 |
| 2023 | $17,335 | $1,469,100 | $566,400 | $902,700 |
| 2022 | $16,348 | $1,306,800 | $429,100 | $877,700 |
| 2021 | $16,656 | $1,298,200 | $420,500 | $877,700 |
| 2020 | $16,085 | $1,298,200 | $420,500 | $877,700 |
| 2019 | $14,889 | $1,229,500 | $351,800 | $877,700 |
| 2018 | $5,542 | $1,184,400 | $334,700 | $849,700 |
| 2017 | $4,479 | $1,096,300 | $0 | $1,096,300 |
| 2016 | $11,803 | $1,010,500 | $0 | $1,010,500 |
| 2015 | $11,920 | $981,900 | $0 | $981,900 |
| 2014 | $10,189 | $804,800 | $0 | $804,800 |
Source: Public Records
Map
Nearby Homes
- 37 Mayflower Rd
- 281 Forest St
- 1 Plymouth Rd
- 276 High St
- 30 Whipple Rd
- 541 Summer St
- 94 Johnson Rd
- 151-153 Forest St
- 21 Montague St
- 7 Whipple Rd
- 64 Overlook Rd
- 106-108 Forest St Unit 106
- 106 Forest St
- 455 Summer St Unit 455
- 7 Bow St
- 8 Farm Rd
- 14 Nassau Dr
- 7 Park Avenue Extension
- 54 Johnson Rd
- 1 Watermill Place Unit 316
Your Personal Tour Guide
Ask me questions while you tour the home.