71 Laurel St Lynn, MA 01905
Lower Boston Street NeighborhoodEstimated Value: $739,874 - $1,136,000
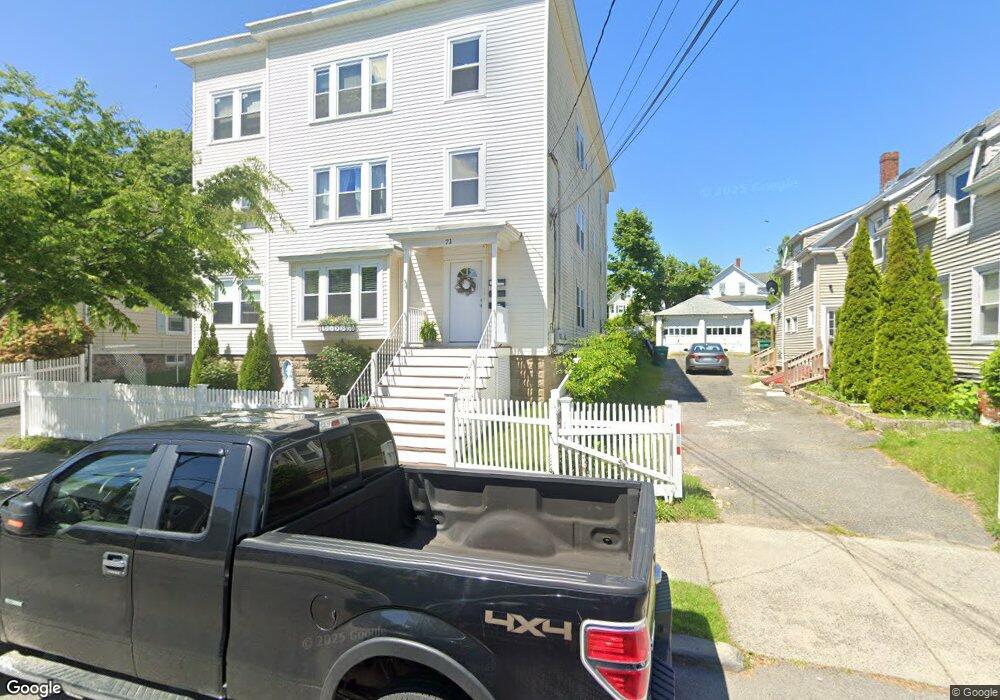
About This Home
This home is located at 71 Laurel St, Lynn, MA 01905 and is currently estimated at $961,719, approximately $238 per square foot. 71 Laurel St is a home located in Essex County with nearby schools including William R. Fallon School, Drewicz Elementary School, and Breed Middle School.
Ownership History
We collect this data history from publicly available records. To have your information removed, we recommend requesting removal directly through your county’s website.
Purchase Details
Home Financials for this Owner
Home Financials are based on the most recent Mortgage that was taken out on this home.Purchase Details
Home Values in the Area
Average Home Value in this Area
Purchase History
We collect this data history from publicly available records. To have your information removed, we recommend requesting removal directly through your county’s website.
| Date | Buyer | Sale Price | Title Company |
|---|---|---|---|
| -- | -- | ||
| -- | -- | ||
| $173,000 | -- | ||
| $173,000 | -- |
Mortgage History
We collect this data history from publicly available records. To have your information removed, we recommend requesting removal directly through your county’s website.
| Date | Status | Borrower | Loan Amount |
|---|---|---|---|
| Open | $400,000 | ||
| Closed | $45,500 | ||
| Closed | $395,000 |
Tax History
We collect this data history from publicly available records. To have your information removed, we recommend requesting removal directly through your county’s website.
| Year | Tax Paid | Tax Assessment Tax Assessment Total Assessment is a certain percentage of the fair market value that is determined by local assessors to be the total taxable value of land and additions on the property. | Land | Improvement |
|---|---|---|---|---|
| 2025 | $9,765 | $942,600 | $200,500 | $742,100 |
| 2024 | $9,702 | $921,400 | $186,400 | $735,000 |
| 2023 | $9,697 | $869,700 | $206,200 | $663,500 |
| 2022 | $9,434 | $759,000 | $157,900 | $601,100 |
| 2021 | $8,256 | $633,600 | $136,400 | $497,200 |
| 2020 | $8,013 | $598,000 | $139,900 | $458,100 |
| 2019 | $7,792 | $544,900 | $125,000 | $419,900 |
| 2018 | $7,142 | $471,400 | $112,700 | $358,700 |
| 2017 | $6,878 | $440,900 | $98,700 | $342,200 |
| 2016 | $6,441 | $398,100 | $90,800 | $307,300 |
| 2015 | $6,002 | $358,300 | $93,400 | $264,900 |
Map
- 51 Laurel St
- 56 Raddin Grove Ave
- 11 Willis Ct
- 21 Margin St Unit 33
- 21 Margin St Unit 34
- 17 Margin St Unit 14
- 16 Margin St Unit 8
- 15 Perley St
- 76-78 Linden St
- 28 Margin St Unit A
- 86 Farrell Rd
- 56 Gardiner St
- 47 Myrtle St
- 15 Flint St
- 76 River St
- 74 Myrtle St
- 20 Heaths Ct Unit 201
- 504 Summer St
- 26 Kirtland St
- 10 Richard St
Ask me questions while you tour the home.