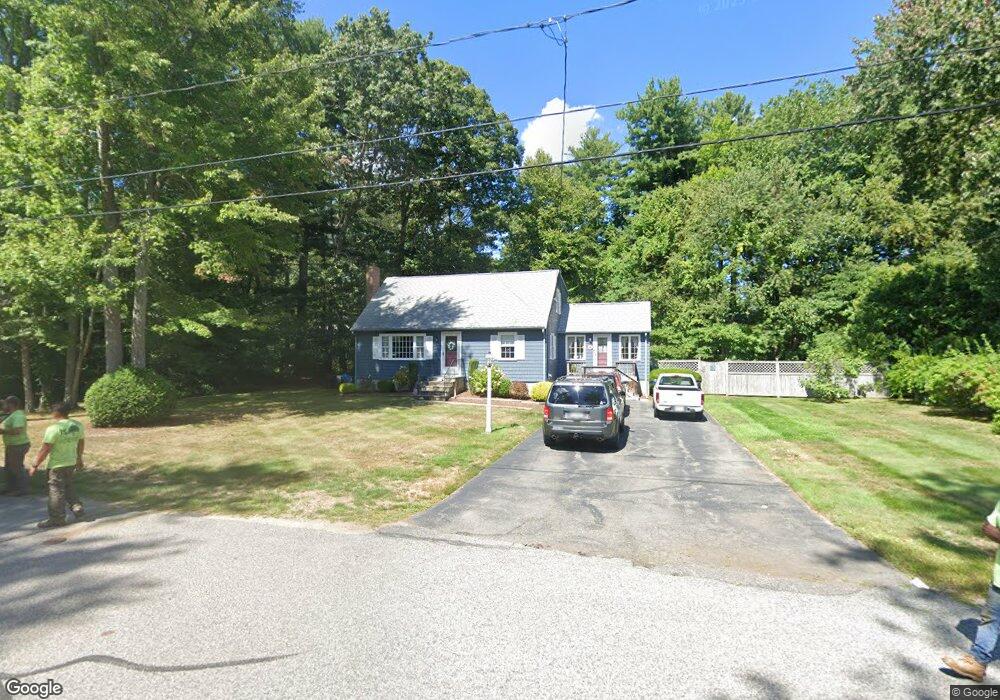
71 Oldfield Dr Hanover, MA 02339
Hanover AreaEstimated Value: $694,000 - $851,000
About This Home
This home is located at 71 Oldfield Dr, Hanover, MA 02339 and is currently estimated at $763,552, approximately $459 per square foot. 71 Oldfield Dr is a home located in Plymouth County with nearby schools including Hanover High School, Calvary Chapel Academy, and Holy Family Elementary School.
Ownership History
We collect this data history from publicly available records. To have your information removed, we recommend requesting removal directly through your county’s website.
Purchase Details
Purchase Details
Home Values in the Area
Average Home Value in this Area
Purchase History
We collect this data history from publicly available records. To have your information removed, we recommend requesting removal directly through your county’s website.
| Date | Buyer | Sale Price | Title Company |
|---|---|---|---|
| -- | None Available | ||
| -- | -- |
Mortgage History
We collect this data history from publicly available records. To have your information removed, we recommend requesting removal directly through your county’s website.
| Date | Status | Borrower | Loan Amount |
|---|---|---|---|
| Previous Owner | $40,000 |
Tax History
We collect this data history from publicly available records. To have your information removed, we recommend requesting removal directly through your county’s website.
| Year | Tax Paid | Tax Assessment Tax Assessment Total Assessment is a certain percentage of the fair market value that is determined by local assessors to be the total taxable value of land and additions on the property. | Land | Improvement |
|---|---|---|---|---|
| 2025 | $6,902 | $558,900 | $269,400 | $289,500 |
| 2024 | $6,767 | $527,000 | $269,400 | $257,600 |
| 2023 | $6,454 | $478,400 | $244,900 | $233,500 |
| 2022 | $6,872 | $450,600 | $244,900 | $205,700 |
| 2021 | $5,900 | $420,900 | $222,600 | $198,300 |
| 2020 | $14,378 | $417,400 | $222,600 | $194,800 |
| 2019 | $6,428 | $391,700 | $222,600 | $169,100 |
| 2018 | $6,323 | $388,400 | $222,600 | $165,800 |
| 2017 | $5,876 | $355,700 | $209,500 | $146,200 |
| 2016 | $5,734 | $340,100 | $190,500 | $149,600 |
| 2015 | $5,381 | $333,200 | $190,500 | $142,700 |
Map
- 120 Deerfield Ln
- 70 Holly Berry Ln
- 42 Bard Rock Ln
- 13 Midfield Dr Unit 13
- 25 Buffum Rd
- 14 Sugar Maple Cir Unit 14
- 57 Marks St
- 16 Holly Ct
- 5 Blueberry Ct
- 198 Pond St
- 375 Webster St
- 142 Marks St
- 6 Lydon Ln Unit C1
- 659 Liberty St
- 373 E Water St
- 99 Boxberry Ln Unit 99
- 179 High St
- 313 E Water St
- 177 High St
- 978 Main St
Ask me questions while you tour the home.