71 Saint Anthony St Unit 73 Chicopee, MA 01013
Willimansett NeighborhoodEstimated Value: $440,000 - $582,000
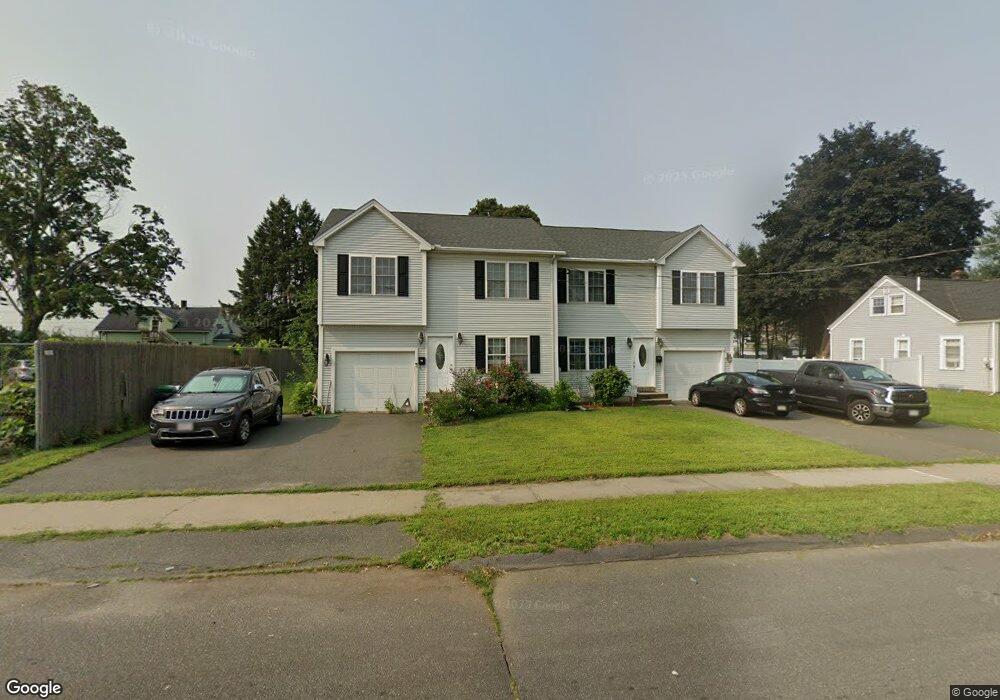
About This Home
This home is located at 71 Saint Anthony St Unit 73, Chicopee, MA 01013 and is currently estimated at $504,921, approximately $181 per square foot. 71 Saint Anthony St Unit 73 is a home located in Hampden County with nearby schools including Fairview Elementary School, Bellamy Middle School, and Chicopee High School.
Ownership History
We collect this data history from publicly available records. To have your information removed, we recommend requesting removal directly through your county’s website.
Purchase Details
Home Financials for this Owner
Home Financials are based on the most recent Mortgage that was taken out on this home.Home Values in the Area
Average Home Value in this Area
Purchase History
We collect this data history from publicly available records. To have your information removed, we recommend requesting removal directly through your county’s website.
| Date | Buyer | Sale Price | Title Company |
|---|---|---|---|
| $65,000 | -- |
Mortgage History
We collect this data history from publicly available records. To have your information removed, we recommend requesting removal directly through your county’s website.
| Date | Status | Borrower | Loan Amount |
|---|---|---|---|
| Open | $280,000 |
Tax History
We collect this data history from publicly available records. To have your information removed, we recommend requesting removal directly through your county’s website.
| Year | Tax Paid | Tax Assessment Tax Assessment Total Assessment is a certain percentage of the fair market value that is determined by local assessors to be the total taxable value of land and additions on the property. | Land | Improvement |
|---|---|---|---|---|
| 2025 | $7,080 | $467,000 | $101,000 | $366,000 |
| 2024 | $6,565 | $444,800 | $99,000 | $345,800 |
| 2023 | $6,087 | $401,800 | $90,000 | $311,800 |
| 2022 | $5,782 | $340,300 | $78,200 | $262,100 |
| 2021 | $5,600 | $318,000 | $71,100 | $246,900 |
| 2020 | $5,289 | $302,900 | $71,100 | $231,800 |
| 2019 | $5,217 | $290,500 | $71,100 | $219,400 |
| 2018 | $5,090 | $278,000 | $67,700 | $210,300 |
| 2017 | $4,284 | $247,500 | $67,700 | $179,800 |
| 2016 | $4,221 | $249,600 | $67,700 | $181,900 |
| 2015 | $4,406 | $251,200 | $67,700 | $183,500 |
| 2014 | $4,147 | $251,200 | $67,700 | $183,500 |
Map
- 43 Ferry St
- 42 Ferry St
- 621 Chicopee St
- 28 State St
- 60 Forest St
- 92 Walter St
- 55 Empire St Unit 11
- 38 Bonner St
- 94 Cora Ave
- 437 Chicopee St
- 38 Whitman St
- 24 Daley St
- 43 Grace St
- 90 Mckinstry Ave Unit 117
- 90 Mckinstry Ave Unit 106
- 958 Main St
- 83 Mckinstry Ave
- 340 Dale St Unit H
- 340 Dale St Unit N
- 71 Worthington St
- 238 Meadow St
- 61 Saint Anthony St
- 254 Meadow St
- 68 Charpentier Blvd
- 78 Charpentier Blvd
- 53 St Anthony St
- 256 Meadow St
- 58 Charpentier Blvd
- 53 Saint Anthony St
- 235 Meadow St
- 43 Saint Anthony St
- 54 Charpentier Blvd
- 229 Meadow St
- 0 Gagne St
- 274 Meadow St
- 48 Charpentier Blvd
- 77 Charpentier Blvd
- 73 Charpentier Blvd
- 67 Charpentier Blvd
- 38 St Anthony St
Ask me questions while you tour the home.