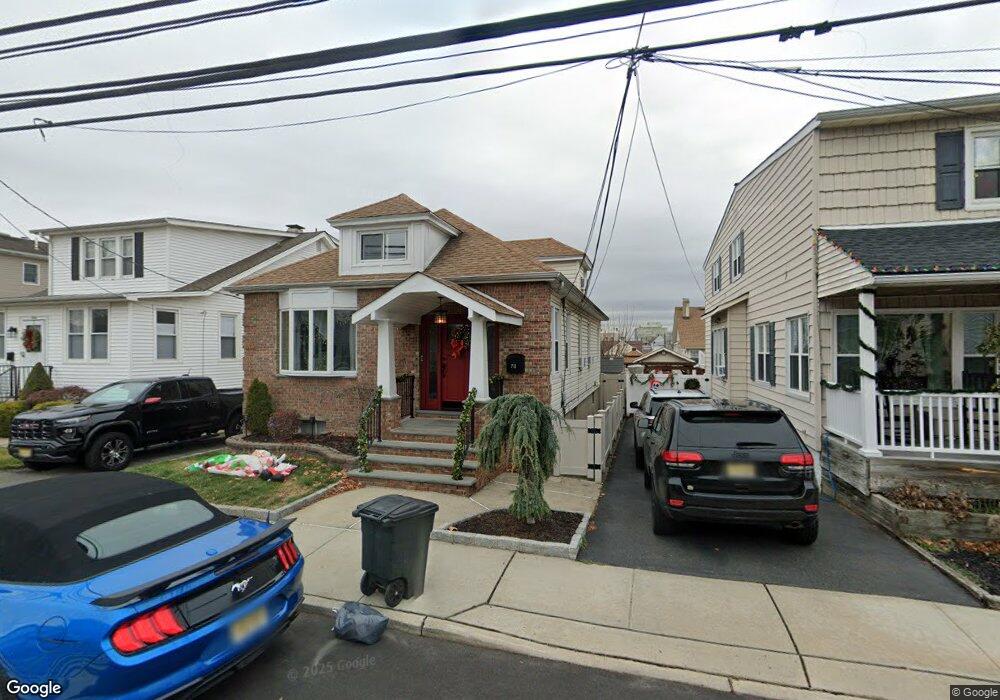
711 5th St Secaucus, NJ 07094
Estimated Value: $488,638 - $648,000
--
Bed
--
Bath
1,545
Sq Ft
$386/Sq Ft
Est. Value
About This Home
This home is located at 711 5th St, Secaucus, NJ 07094 and is currently estimated at $596,410, approximately $386 per square foot. 711 5th St is a home located in Hudson County with nearby schools including Secaucus High School.
Ownership History
Date
Name
Owned For
Owner Type
Purchase Details
Closed on
Mar 14, 2005
Sold by
Purcell Joseph J and Purcell Helen A
Bought by
Gallo Ronald J and Gallo Donna M
Current Estimated Value
Home Financials for this Owner
Home Financials are based on the most recent Mortgage that was taken out on this home.
Original Mortgage
$172,000
Outstanding Balance
$93,121
Interest Rate
5.56%
Mortgage Type
Fannie Mae Freddie Mac
Purchase Details
Closed on
Oct 18, 2002
Sold by
Purcell Joseph J and Purcell Audrey H
Bought by
Purcell Joseph J and Purcell Helen A
Create a Home Valuation Report for This Property
The Home Valuation Report is an in-depth analysis detailing your home's value as well as a comparison with similar homes in the area
Home Values in the Area
Average Home Value in this Area
Purchase History
Date | Buyer | Sale Price | Title Company |
---|---|---|---|
Gallo Ronald J | $215,000 | -- | |
Purcell Joseph J | -- | -- |
Source: Public Records
Mortgage History
Date | Status | Borrower | Loan Amount |
---|---|---|---|
Open | Gallo Ronald J | $172,000 | |
Previous Owner | Purcell Joseph J | $60,000 |
Source: Public Records
Tax History Compared to Growth
Tax History
Year | Tax Paid | Tax Assessment Tax Assessment Total Assessment is a certain percentage of the fair market value that is determined by local assessors to be the total taxable value of land and additions on the property. | Land | Improvement |
---|---|---|---|---|
2024 | $5,525 | $139,200 | $72,300 | $66,900 |
2023 | $5,525 | $139,200 | $72,300 | $66,900 |
2022 | $5,238 | $139,200 | $72,300 | $66,900 |
2021 | $5,248 | $139,200 | $72,300 | $66,900 |
2020 | $5,201 | $139,200 | $72,300 | $66,900 |
2019 | $5,167 | $139,200 | $72,300 | $66,900 |
2018 | $5,025 | $139,200 | $72,300 | $66,900 |
2017 | $5,031 | $139,200 | $72,300 | $66,900 |
2016 | $5,160 | $139,200 | $72,300 | $66,900 |
2015 | $5,153 | $139,200 | $72,300 | $66,900 |
2014 | $5,242 | $139,200 | $72,300 | $66,900 |
Source: Public Records
Map
Nearby Homes