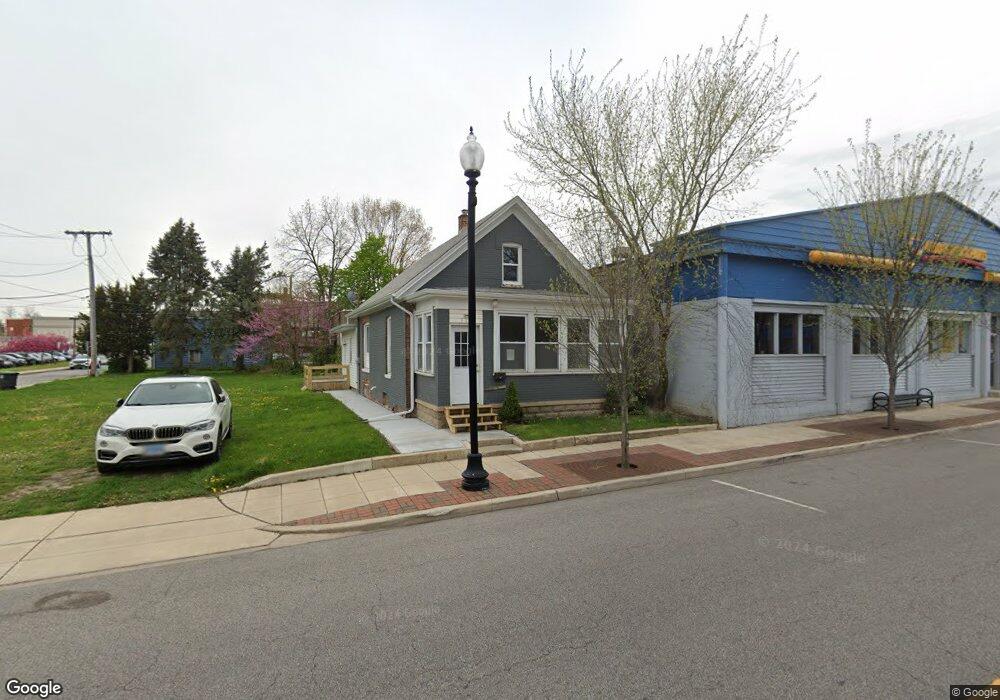
711 E 3rd St Hobart, IN 46342
Estimated Value: $136,000 - $181,000
2
Beds
1
Bath
1,832
Sq Ft
$85/Sq Ft
Est. Value
About This Home
This home is located at 711 E 3rd St, Hobart, IN 46342 and is currently estimated at $156,315, approximately $85 per square foot. 711 E 3rd St is a home located in Lake County with nearby schools including Hobart High School, Hobart Baptist School, and Trinity Lutheran School.
Ownership History
Date
Name
Owned For
Owner Type
Purchase Details
Closed on
Dec 5, 2020
Sold by
Madson Russell J
Bought by
Bellman Ryan E
Current Estimated Value
Purchase Details
Closed on
Feb 17, 2010
Sold by
Thomas Dorothy M and David E Thomas Revocable Trust
Bought by
Madson Russell J
Home Financials for this Owner
Home Financials are based on the most recent Mortgage that was taken out on this home.
Original Mortgage
$44,000
Interest Rate
7.5%
Mortgage Type
Purchase Money Mortgage
Purchase Details
Closed on
Dec 19, 2006
Sold by
Thomas Dorothy M
Bought by
Madson Russell J
Create a Home Valuation Report for This Property
The Home Valuation Report is an in-depth analysis detailing your home's value as well as a comparison with similar homes in the area
Home Values in the Area
Average Home Value in this Area
Purchase History
| Date | Buyer | Sale Price | Title Company |
|---|---|---|---|
| Bellman Ryan E | -- | Community Title Company | |
| Madson Russell J | -- | Ticor Title Company | |
| Madson Russell J | $48,000 | None Available |
Source: Public Records
Mortgage History
| Date | Status | Borrower | Loan Amount |
|---|---|---|---|
| Previous Owner | Madson Russell J | $44,000 | |
| Closed | Madson Russell J | $0 |
Source: Public Records
Tax History
| Year | Tax Paid | Tax Assessment Tax Assessment Total Assessment is a certain percentage of the fair market value that is determined by local assessors to be the total taxable value of land and additions on the property. | Land | Improvement |
|---|---|---|---|---|
| 2025 | $2,743 | $112,800 | $15,600 | $97,200 |
| 2024 | $3,927 | $96,200 | $15,600 | $80,600 |
| 2023 | $2,289 | $96,200 | $15,600 | $80,600 |
| 2022 | $2,289 | $94,800 | $15,600 | $79,200 |
| 2021 | $1,617 | $66,200 | $12,000 | $54,200 |
| 2020 | $1,522 | $62,600 | $12,000 | $50,600 |
| 2019 | $1,862 | $60,300 | $12,000 | $48,300 |
| 2018 | $1,906 | $57,500 | $12,000 | $45,500 |
| 2017 | $2,055 | $57,700 | $12,000 | $45,700 |
| 2016 | $2,403 | $57,800 | $12,000 | $45,800 |
| 2014 | $1,692 | $57,500 | $12,000 | $45,500 |
| 2013 | $1,701 | $57,700 | $12,000 | $45,700 |
Source: Public Records
Map
Nearby Homes
- 808 E 3rd St
- 529 Lake St
- 112 S Indiana St
- 36 N Linda St
- 652 S State St
- 429 S Joliet St
- 717 Lake St
- 400 S Liberty St
- 140 N Linda St
- 753 Fleming St
- 511 S Liberty St
- 7 Beverly Blvd
- 90 Harbor Club Dr
- 220 N Lake Park Ave
- 8 Indiana 130
- 812 S Lake Park Ave
- 773 South St
- 147 S Connecticut St
- 915 Paula Ct
- 811 Henry Ct
Your Personal Tour Guide
Ask me questions while you tour the home.