711 Pennington St Houston, TX 77022
Northside-Northline NeighborhoodEstimated Value: $246,000 - $306,000
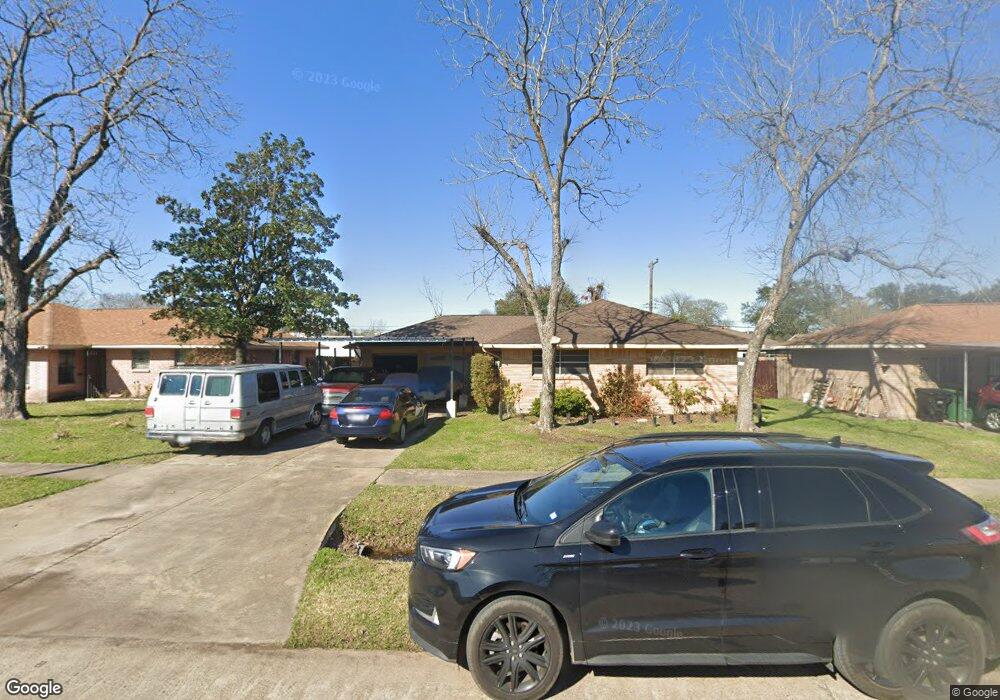
About This Home
This home is located at 711 Pennington St, Houston, TX 77022 and is currently estimated at $263,351, approximately $183 per square foot. 711 Pennington St is a home located in Harris County with nearby schools including Burbank Elementary School, Burbank Middle School, and Sam Houston Math, Science & Technology Center.
Ownership History
We collect this data history from publicly available records. To have your information removed, we recommend requesting removal directly through your county’s website.
Purchase Details
Home Financials for this Owner
Home Financials are based on the most recent Mortgage that was taken out on this home.Home Values in the Area
Average Home Value in this Area
Purchase History
We collect this data history from publicly available records. To have your information removed, we recommend requesting removal directly through your county’s website.
| Date | Buyer | Sale Price | Title Company |
|---|---|---|---|
| -- | Commonwealth Title Houston |
Mortgage History
We collect this data history from publicly available records. To have your information removed, we recommend requesting removal directly through your county’s website.
| Date | Status | Borrower | Loan Amount |
|---|---|---|---|
| Open | $94,724 |
Tax History
We collect this data history from publicly available records. To have your information removed, we recommend requesting removal directly through your county’s website.
| Year | Tax Paid | Tax Assessment Tax Assessment Total Assessment is a certain percentage of the fair market value that is determined by local assessors to be the total taxable value of land and additions on the property. | Land | Improvement |
|---|---|---|---|---|
| 2025 | $31 | $231,289 | $94,635 | $136,654 |
| 2024 | $15 | $220,990 | $86,853 | $134,137 |
| 2023 | $15 | $264,188 | $52,921 | $211,267 |
| 2022 | $3,562 | $220,600 | $52,921 | $167,679 |
| 2021 | $3,428 | $174,183 | $52,921 | $121,262 |
| 2020 | $3,238 | $160,301 | $52,921 | $107,380 |
| 2019 | $3,076 | $157,471 | $43,582 | $113,889 |
| 2018 | $296 | $126,518 | $36,422 | $90,096 |
| 2017 | $5,080 | $126,518 | $36,422 | $90,096 |
| 2016 | $2,309 | $101,636 | $34,243 | $67,393 |
| 2015 | $292 | $83,018 | $24,904 | $58,114 |
| 2014 | $292 | $83,018 | $24,904 | $58,114 |
Map
- 9026 Mcgallion Rd
- 324 Charlock St
- 721 Doverside St
- 267 De Boll St
- 216 Burress St
- 7821 Melrose St
- 202 Burbank St
- 219 Heaney Dr
- 161 Luther St
- 8440 Berry Brush Ln
- 407 Turner Dr
- 9105 Exeter St
- 132 Grothe Ln
- 9016 Fulton St
- 9204 Exeter St
- 1310 Duff Ln
- 1308 Duff Ln
- 9906 Dipping Brook St
- 802 Berry Sage Ln
- 1304 Duff Ln
- 703 Pennington St
- 707 Pennington St
- 702 Hurley St
- 706 Hurley St
- 9207 Helmers St
- 9211 Helmers St
- 9203 Helmers St
- 710 Hurley St
- 706 Pennington St
- 9215 Helmers St
- 715 Pennington St
- 9135 Helmers St
- 710 Pennington St
- 714 Hurley St
- 9131 Helmers St
- 714 Pennington St
- 703 Hurley St
- 643 Hurley St
- 703 Hohl St
- 9210 Melrose St
Ask me questions while you tour the home.