711 Skipjack Dr Henderson, NV 89015
Foothills NeighborhoodEstimated Value: $389,000 - $430,000
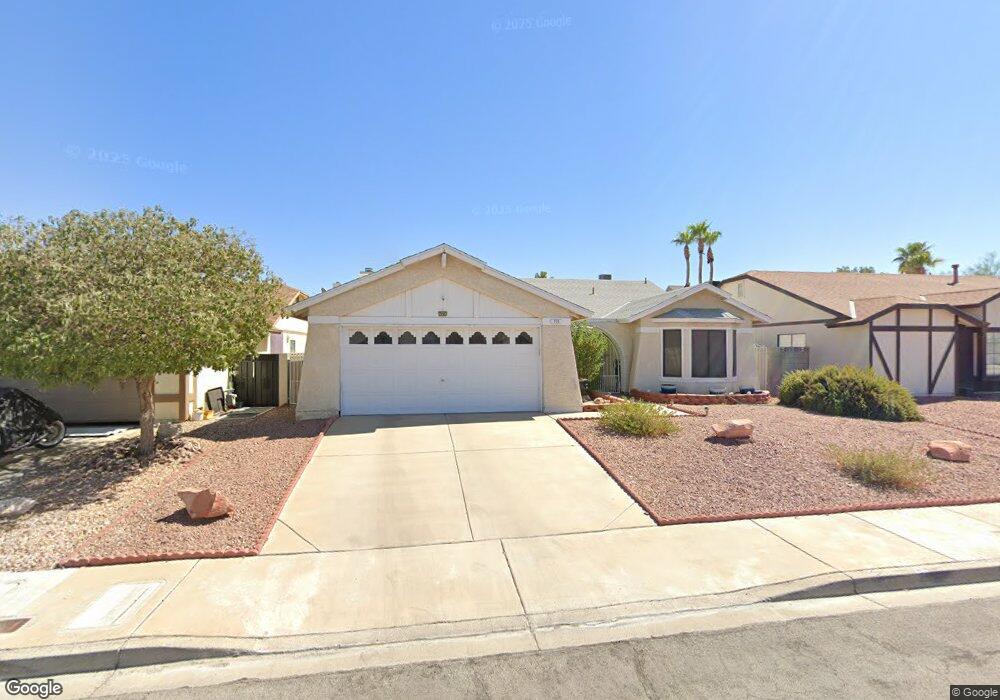
About This Home
This home is located at 711 Skipjack Dr, Henderson, NV 89015 and is currently estimated at $406,692, approximately $240 per square foot. 711 Skipjack Dr is a home located in Clark County with nearby schools including Sue H. Morrow Elementary School, B Mahlon Brown Academy of International Studies, and Basic Academy of International Studies.
Ownership History
We collect this data history from publicly available records. To have your information removed, we recommend requesting removal directly through your county’s website.
Purchase Details
Purchase Details
Home Values in the Area
Average Home Value in this Area
Purchase History
We collect this data history from publicly available records. To have your information removed, we recommend requesting removal directly through your county’s website.
| Date | Buyer | Sale Price | Title Company |
|---|---|---|---|
| $12,000 | -- | ||
| $117,000 | Fidelity National Title |
Mortgage History
We collect this data history from publicly available records. To have your information removed, we recommend requesting removal directly through your county’s website.
| Date | Status | Borrower | Loan Amount |
|---|---|---|---|
| Open | $435,000 | ||
| Closed | $25,000 | ||
| Closed | $176,655 | ||
| Closed | $187,220 | ||
| Closed | $40,000 | ||
| Closed | $20,000 | ||
| Closed | $12,200 | ||
| Closed | $134,500 |
Tax History
We collect this data history from publicly available records. To have your information removed, we recommend requesting removal directly through your county’s website.
| Year | Tax Paid | Tax Assessment Tax Assessment Total Assessment is a certain percentage of the fair market value that is determined by local assessors to be the total taxable value of land and additions on the property. | Land | Improvement |
|---|---|---|---|---|
| 2026 | $1,639 | $78,028 | $32,550 | $45,478 |
| 2025 | $1,518 | $74,682 | $28,000 | $46,682 |
| 2024 | $1,406 | $74,682 | $28,000 | $46,682 |
| 2023 | $1,406 | $74,173 | $29,050 | $45,123 |
| 2022 | $1,302 | $68,491 | $26,950 | $41,541 |
| 2021 | $1,206 | $61,485 | $21,700 | $39,785 |
| 2020 | $1,117 | $60,740 | $21,000 | $39,740 |
| 2019 | $1,046 | $58,649 | $19,250 | $39,399 |
| 2018 | $999 | $54,343 | $16,100 | $38,243 |
| 2017 | $1,547 | $53,272 | $14,350 | $38,922 |
| 2016 | $936 | $47,149 | $7,700 | $39,449 |
| 2015 | $933 | $36,724 | $7,700 | $29,024 |
| 2014 | $904 | $30,578 | $7,000 | $23,578 |
Map
- 163 Emden Dr
- 128 Kava St
- 206 Oleander Place
- 849 Ashford Way
- 874 Ashford Way
- 802 Mesa Pine Ct
- 412 Cindy Place
- 163 Spinnaker Dr
- 206 Valerian St
- 865 Bussora Rose Dr
- 208 Night Fall Terrace
- 447 Groft Way
- 915 N Major Ave
- 850 Purple Sage Terrace
- 749 Beach Park St
- 875 Chaste Ct
- 839 Fairview Dr
- 914 Palo Verde Dr
- 0 Cannes St
- 0 Cannes St
- 715 Skipjack Dr
- 713 Skipjack Dr
- 717 Skipjack Dr
- 719 Skipjack Dr
- 818 Schooner Dr
- 814 Schooner Dr
- 820 Schooner Dr
- 812 Schooner Dr
- 822 Schooner Dr
- 716 Skipjack Dr
- 721 Skipjack Dr
- 714 Skipjack Dr Unit 2
- 709 Skipjack Dr
- 718 Skipjack Dr
- 810 Schooner Dr
- 824 Schooner Dr
- 712 Skipjack Dr Unit 2
- 720 Skipjack Dr
- 808 Schooner Dr
- 826 Schooner Dr
Ask me questions while you tour the home.