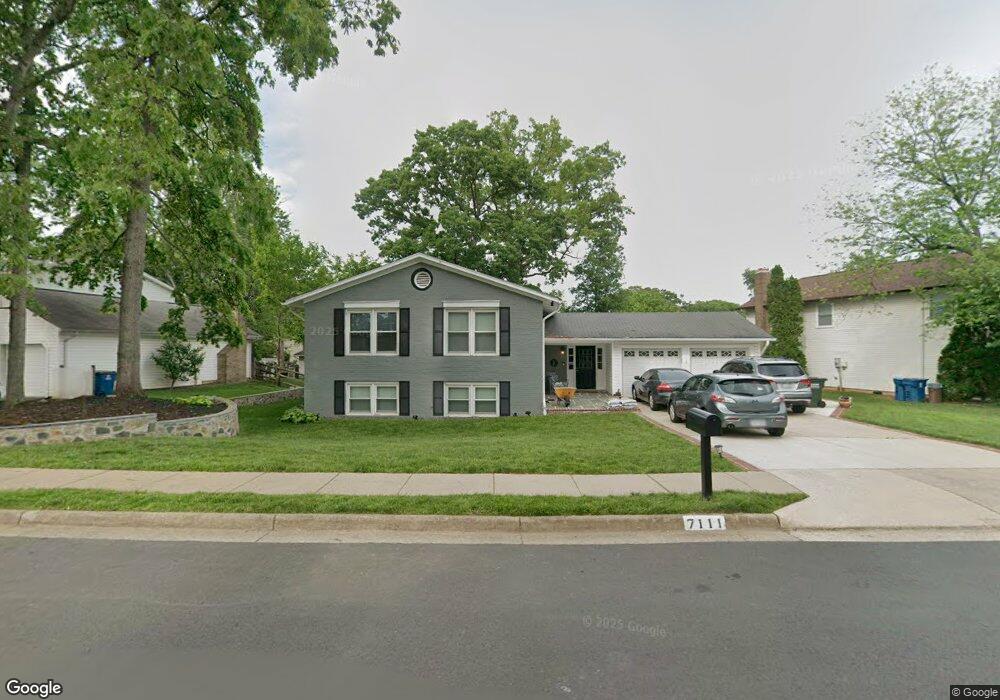
7111 Sontag Way Springfield, VA 22153
Estimated Value: $802,000 - $845,572
4
Beds
4
Baths
1,454
Sq Ft
$563/Sq Ft
Est. Value
About This Home
This home is located at 7111 Sontag Way, Springfield, VA 22153 and is currently estimated at $817,893, approximately $562 per square foot. 7111 Sontag Way is a home located in Fairfax County with nearby schools including Orange Hunt Elementary School, Irving Middle School, and West Springfield High School.
Ownership History
Date
Name
Owned For
Owner Type
Purchase Details
Closed on
Oct 6, 2016
Sold by
Connolly Robert R
Bought by
Connolly Robert E
Current Estimated Value
Home Financials for this Owner
Home Financials are based on the most recent Mortgage that was taken out on this home.
Original Mortgage
$388,110
Outstanding Balance
$316,263
Interest Rate
3.99%
Mortgage Type
New Conventional
Estimated Equity
$501,630
Create a Home Valuation Report for This Property
The Home Valuation Report is an in-depth analysis detailing your home's value as well as a comparison with similar homes in the area
Home Values in the Area
Average Home Value in this Area
Purchase History
We collect this data history from publicly available records. To have your information removed, we recommend requesting removal directly through your county’s website.
| Date | Buyer | Sale Price | Title Company |
|---|---|---|---|
| Connolly Robert E | $171,000 | None Available |
Source: Public Records
Mortgage History
We collect this data history from publicly available records. To have your information removed, we recommend requesting removal directly through your county’s website.
| Date | Status | Borrower | Loan Amount |
|---|---|---|---|
| Open | Connolly Robert E | $388,110 |
Source: Public Records
Tax History
| Year | Tax Paid | Tax Assessment Tax Assessment Total Assessment is a certain percentage of the fair market value that is determined by local assessors to be the total taxable value of land and additions on the property. | Land | Improvement |
|---|---|---|---|---|
| 2025 | $8,638 | $774,020 | $320,000 | $454,020 |
| 2024 | $8,638 | $745,600 | $310,000 | $435,600 |
| 2023 | $7,999 | $708,780 | $295,000 | $413,780 |
| 2022 | $7,797 | $681,810 | $285,000 | $396,810 |
| 2021 | $7,122 | $606,920 | $255,000 | $351,920 |
| 2020 | $6,717 | $567,520 | $240,000 | $327,520 |
| 2019 | $6,347 | $536,260 | $230,000 | $306,260 |
| 2018 | $6,044 | $525,600 | $230,000 | $295,600 |
| 2017 | $5,928 | $510,600 | $215,000 | $295,600 |
| 2016 | $6,008 | $518,590 | $220,000 | $298,590 |
| 2015 | $5,411 | $484,820 | $205,000 | $279,820 |
| 2014 | $5,277 | $473,940 | $195,000 | $278,940 |
Source: Public Records
Map
Nearby Homes
- 8910 Spur Rd
- 6901 Huntsman Blvd
- 8714 Arley Dr
- 7001 Spur Rd
- 9217 Rockefeller Ln
- 9062 Gavelwood Ct
- 9117 Galbreth Ct
- 8723 Cuttermill Place
- 6803 Jackie Deneese Ct
- 9113 Donna Dean Dr
- 7212 Galgate Dr
- 7221 Galgate Dr
- 9122 Steven Irving Ct
- 7013 Galgate Dr
- 6710 Sydenstricker Rd
- 7011 Spaniel Rd
- 8615 Kerry Ln
- 7604 Bertito Ln
- 8513 Fairburn Dr
- 9207 Antelope Place
- 7117 Sontag Way
- 7106 Kesley Ct
- 7107 Kesley Ct
- 7119 Sontag Way
- 7110 Sontag Way
- 7112 Sontag Way
- 7107 Sontag Way
- 7104 Kesley Ct
- 7118 Sontag Way
- 7105 Kesley Ct
- 8905 Tailcoat Ct
- 7103 Sontag Way
- 7121 Sontag Way
- 8900 Tailcoat Ct
- 8806 Newell Ct
- 7116 Sontag Way
- 7114 Sontag Way
- 7103 Kesley Ct
- 7120 Sontag Way
- 8902 Tailcoat Ct
Your Personal Tour Guide
Ask me questions while you tour the home.