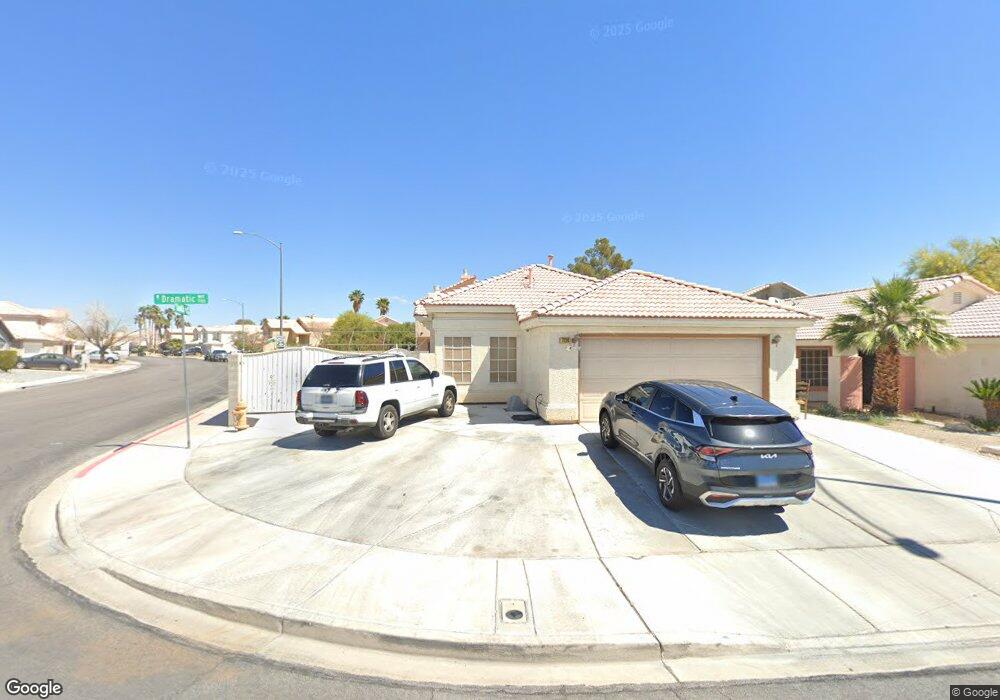
7124 Dramatic Way Las Vegas, NV 89130
North Cheyenne NeighborhoodEstimated Value: $370,000 - $423,000
3
Beds
2
Baths
1,285
Sq Ft
$305/Sq Ft
Est. Value
About This Home
This home is located at 7124 Dramatic Way, Las Vegas, NV 89130 and is currently estimated at $391,511, approximately $304 per square foot. 7124 Dramatic Way is a home located in Clark County with nearby schools including Joseph M Neal Elementary School, Anthony Saville Middle School, and Shadow Ridge High School.
Ownership History
Date
Name
Owned For
Owner Type
Purchase Details
Closed on
May 8, 2003
Sold by
Thompson Jeffrey D
Bought by
Andolina Russell T and Andolina Alice L
Current Estimated Value
Home Financials for this Owner
Home Financials are based on the most recent Mortgage that was taken out on this home.
Original Mortgage
$128,803
Outstanding Balance
$54,227
Interest Rate
5.84%
Mortgage Type
FHA
Estimated Equity
$337,284
Purchase Details
Closed on
Sep 16, 1994
Sold by
Stanpark Construction Co Inc
Bought by
Thompson Jeffrey D
Home Financials for this Owner
Home Financials are based on the most recent Mortgage that was taken out on this home.
Original Mortgage
$100,441
Interest Rate
7.5%
Mortgage Type
FHA
Create a Home Valuation Report for This Property
The Home Valuation Report is an in-depth analysis detailing your home's value as well as a comparison with similar homes in the area
Home Values in the Area
Average Home Value in this Area
Purchase History
| Date | Buyer | Sale Price | Title Company |
|---|---|---|---|
| Andolina Russell T | $146,900 | Lawyers Title Of Nevada | |
| Thompson Jeffrey D | -- | Lawyers Title Of Nevada | |
| Thompson Jeffrey D | $101,500 | Land Title |
Source: Public Records
Mortgage History
| Date | Status | Borrower | Loan Amount |
|---|---|---|---|
| Open | Andolina Russell T | $128,803 | |
| Previous Owner | Thompson Jeffrey D | $100,441 |
Source: Public Records
Tax History
| Year | Tax Paid | Tax Assessment Tax Assessment Total Assessment is a certain percentage of the fair market value that is determined by local assessors to be the total taxable value of land and additions on the property. | Land | Improvement |
|---|---|---|---|---|
| 2026 | $1,437 | $84,481 | $36,575 | $47,906 |
| 2025 | $1,395 | $85,961 | $36,960 | $49,001 |
| 2024 | $1,355 | $85,961 | $36,960 | $49,001 |
| 2023 | $1,355 | $81,196 | $34,650 | $46,546 |
| 2022 | $1,442 | $70,130 | $27,335 | $42,795 |
| 2021 | $1,335 | $66,530 | $25,795 | $40,735 |
| 2020 | $1,237 | $66,338 | $25,795 | $40,543 |
| 2019 | $1,159 | $60,865 | $20,790 | $40,075 |
| 2018 | $1,106 | $56,062 | $17,325 | $38,737 |
| 2017 | $1,794 | $54,716 | $15,400 | $39,316 |
| 2016 | $1,036 | $47,918 | $11,165 | $36,753 |
| 2015 | $1,033 | $38,587 | $7,700 | $30,887 |
| 2014 | $1,003 | $32,534 | $7,700 | $24,834 |
Source: Public Records
Map
Nearby Homes
- 5705 Grand Entries Dr
- 5730 Sky Pointe Dr Unit 189
- 5730 Sky Pointe Dr Unit 153
- 7257 Golden Star Ave
- 7265 Sheared Cliff Ln Unit 101
- 7208 Pisa Ave
- 5688 Bishop Flowers St
- 7255 Diamond Canyon Ln Unit 102
- 7290 Sheared Cliff Ln Unit 102
- 5433 Painted Mirage Rd
- 5816 Emperor Way
- 7295 Diamond Canyon Ln Unit 202
- 7252 Vista Bonita Dr
- 5424 Goldbrush St
- 6794 Weeping Fig Ct
- 7233 Vista Bonita Dr
- 5966 Rio Vista St
- 5805 Grand Heritage St
- 5345 Painted Mirage Rd
- 5805 Kane Holly St
- 7120 Dramatic Way
- 7125 Grand Castle Way
- 7116 Dramatic Way
- 7121 Grand Castle Way Unit none
- 5609 Grand Entries Dr
- 5605 Grand Entries Dr
- 7117 Grand Castle Way
- 7125 Dramatic Way
- 5613 Grand Entries Dr
- 7112 Dramatic Way
- 7129 Dramatic Way
- 5601 Grand Entries Dr Unit None
- 5601 Grand Entries Dr
- 7113 Grand Castle Way
- 7117 Dramatic Way Unit n/a
- 7117 Dramatic Way
- 7117 Dramatic Way Unit n
- 7117 Dramatic Way
- 5617 Grand Entries Dr
Your Personal Tour Guide
Ask me questions while you tour the home.