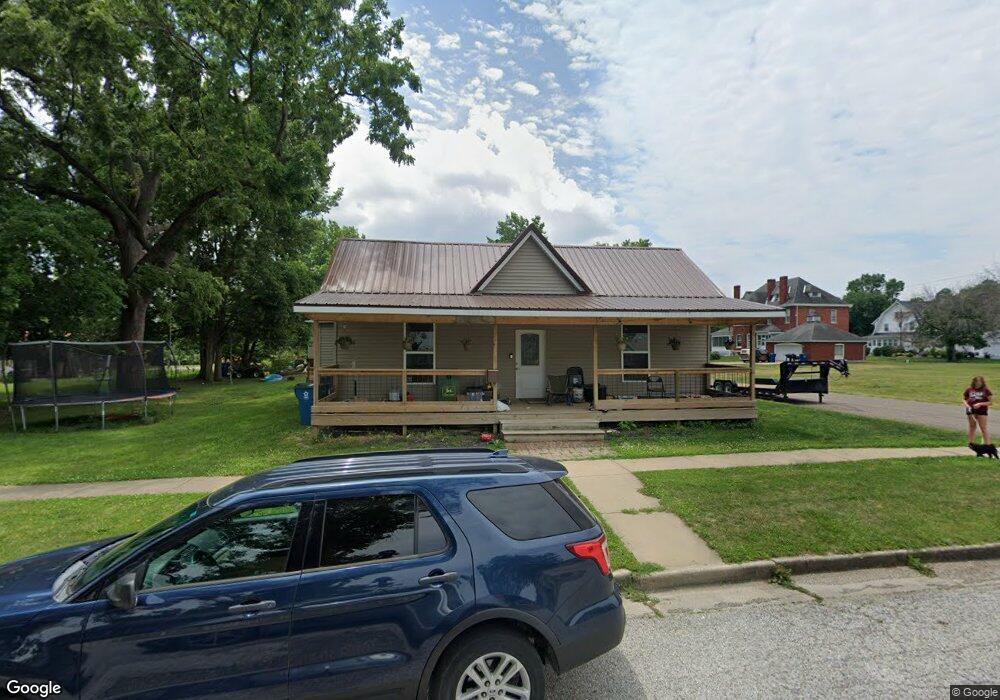
713 Bland St Canton, MO 63435
Estimated Value: $123,000 - $155,365
2
Beds
1
Bath
1,801
Sq Ft
$75/Sq Ft
Est. Value
About This Home
This home is located at 713 Bland St, Canton, MO 63435 and is currently estimated at $135,341, approximately $75 per square foot. 713 Bland St is a home with nearby schools including Canton Elementary School, Canton High School, and Cedar Falls School.
Ownership History
Date
Name
Owned For
Owner Type
Purchase Details
Closed on
Nov 8, 2019
Sold by
Matthes Barry K and Matthes Daitre
Bought by
Stark Austin B and Stark Rachel N
Current Estimated Value
Home Financials for this Owner
Home Financials are based on the most recent Mortgage that was taken out on this home.
Original Mortgage
$61,600
Interest Rate
3.6%
Purchase Details
Closed on
May 11, 2018
Sold by
Griesbaum Crissy Ann Stewart Baker and Griesbaum James
Bought by
Matthes Barry K
Home Financials for this Owner
Home Financials are based on the most recent Mortgage that was taken out on this home.
Original Mortgage
$45,000
Interest Rate
4.44%
Mortgage Type
Credit Line Revolving
Create a Home Valuation Report for This Property
The Home Valuation Report is an in-depth analysis detailing your home's value as well as a comparison with similar homes in the area
Home Values in the Area
Average Home Value in this Area
Purchase History
| Date | Buyer | Sale Price | Title Company |
|---|---|---|---|
| Stark Austin B | -- | None Available | |
| Matthes Barry K | -- | None Available |
Source: Public Records
Mortgage History
| Date | Status | Borrower | Loan Amount |
|---|---|---|---|
| Closed | Stark Austin B | $61,600 | |
| Previous Owner | Matthes Barry K | $45,000 |
Source: Public Records
Tax History
| Year | Tax Paid | Tax Assessment Tax Assessment Total Assessment is a certain percentage of the fair market value that is determined by local assessors to be the total taxable value of land and additions on the property. | Land | Improvement |
|---|---|---|---|---|
| 2025 | $821 | $14,830 | $1,530 | $13,300 |
| 2024 | $700 | $13,070 | $1,350 | $11,720 |
| 2023 | $695 | $13,070 | $1,350 | $11,720 |
| 2022 | $689 | $13,070 | $0 | $0 |
| 2021 | $668 | $13,070 | $0 | $0 |
| 2020 | $387 | $7,350 | $0 | $0 |
| 2019 | $382 | $7,350 | $0 | $0 |
| 2018 | $372 | $7,350 | $1,350 | $6,000 |
| 2017 | $373 | $7,350 | $1,350 | $6,000 |
| 2016 | $343 | $6,780 | $1,350 | $5,430 |
| 2015 | -- | $6,780 | $1,350 | $5,430 |
| 2013 | -- | $6,780 | $0 | $0 |
Source: Public Records
Map
Nearby Homes
- 608 Grant St
- 815 Washington St
- 616 Madison St
- 806 N 8th St
- 515 Madison St
- 511 Madison St
- 14395 Highway F
- 304 Lewis St
- 504 S 5th St
- 704 S Monticello Rd
- 27234 Highway Z
- 1003 Brose Ave
- 0 326th Ave
- 2552 E 543rd
- 110 E Co Road 150
- 501 Knox St
- 14305 Highway F
- 110 E County Rd 150
- 14305 Hwy F
- 2211 E 640th Place
Your Personal Tour Guide
Ask me questions while you tour the home.