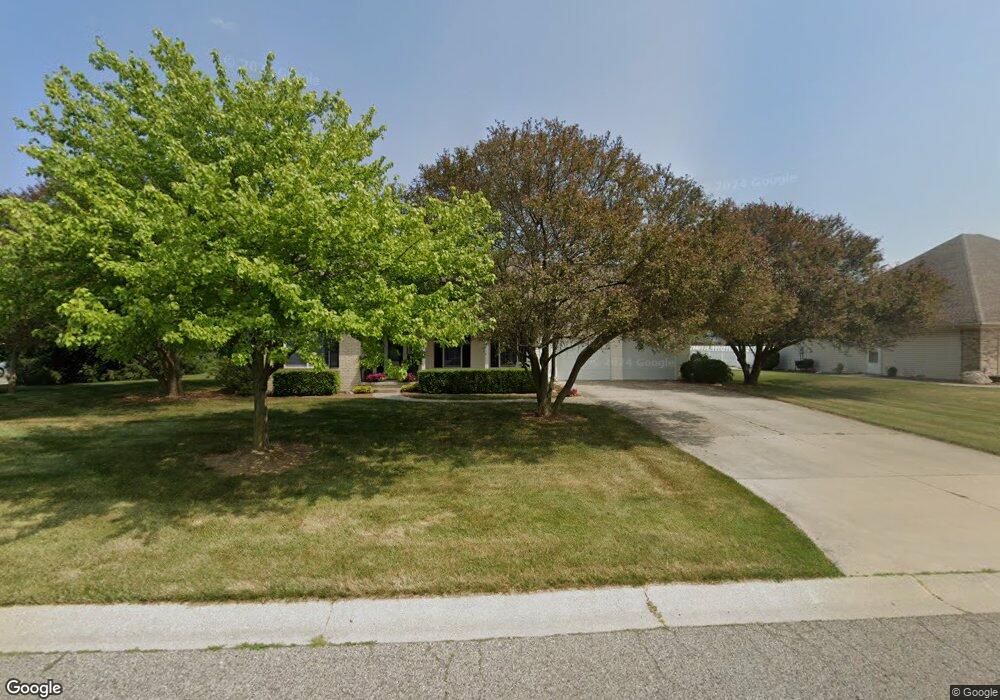
715 Hemlock St Wauseon, OH 43567
Estimated Value: $324,000 - $342,000
4
Beds
2
Baths
2,200
Sq Ft
$153/Sq Ft
Est. Value
About This Home
This home is located at 715 Hemlock St, Wauseon, OH 43567 and is currently estimated at $335,675, approximately $152 per square foot. 715 Hemlock St is a home located in Fulton County with nearby schools including Wauseon Primary School, Wauseon Elementary School, and Wauseon Middle School.
Create a Home Valuation Report for This Property
The Home Valuation Report is an in-depth analysis detailing your home's value as well as a comparison with similar homes in the area
Home Values in the Area
Average Home Value in this Area
Tax History
We collect this data history from publicly available records. To have your information removed, we recommend requesting removal directly through your county’s website.
| Year | Tax Paid | Tax Assessment Tax Assessment Total Assessment is a certain percentage of the fair market value that is determined by local assessors to be the total taxable value of land and additions on the property. | Land | Improvement |
|---|---|---|---|---|
| 2025 | $4,172 | $91,770 | $14,560 | $77,210 |
| 2024 | $4,413 | $91,770 | $14,560 | $77,210 |
| 2023 | $4,564 | $91,770 | $14,560 | $77,210 |
| 2022 | $4,066 | $69,340 | $12,150 | $57,190 |
| 2021 | $4,268 | $69,340 | $12,150 | $57,190 |
| 2020 | $3,975 | $69,340 | $12,150 | $57,190 |
| 2019 | $3,616 | $62,090 | $12,110 | $49,980 |
| 2018 | $3,125 | $62,090 | $12,110 | $49,980 |
| 2017 | $3,081 | $62,090 | $12,110 | $49,980 |
| 2016 | $2,942 | $52,080 | $12,110 | $39,970 |
| 2015 | $2,764 | $52,080 | $12,110 | $39,970 |
| 2014 | $2,621 | $52,080 | $12,110 | $39,970 |
| 2013 | $3,274 | $60,060 | $10,360 | $49,700 |
Source: Public Records
Map
Nearby Homes
- 150 N Shoop Ave
- 555 Wood St
- 435 N Franklin St
- 1030 Old Orchard Dr
- 0 N Glenwood Ave
- 1067 Seneca Dr
- 312 Cherry St
- 245 Vine St
- 231 Mckinley St
- 117 Washington St
- 414 Edgewood Dr
- 460 Airport Hwy
- 514 W Leggett St
- 1338 N Park Ln
- 749 Parkside Dr
- 728 Fairway Dr Unit 5
- 744 Fairway Dr Unit 29
- 794 Fairway Dr
- 14900 County Road H Unit 133
- 14283 County Road Ac
- 710 Hemlock St
- 720 Hemlock St
- 670 Hemlock St
- 730 Hemlock St
- 725 Hemlock St
- 720 N Glenwood St
- 720 N Glenwood Ave
- 660 Hemlock St
- 741 Meadow Ln
- 740 Hemlock St
- 665 Hemlock St
- 710 Spruce St
- 731 Meadow Ln
- 745 Hemlock St
- 720 Spruce St
- 650 Hemlock St
- 670 Spruce St
- 750 Hemlock St
- 730 Spruce St
- 655 Hemlock St
Your Personal Tour Guide
Ask me questions while you tour the home.