Estimated Value: $189,000 - $324,000
About This Home
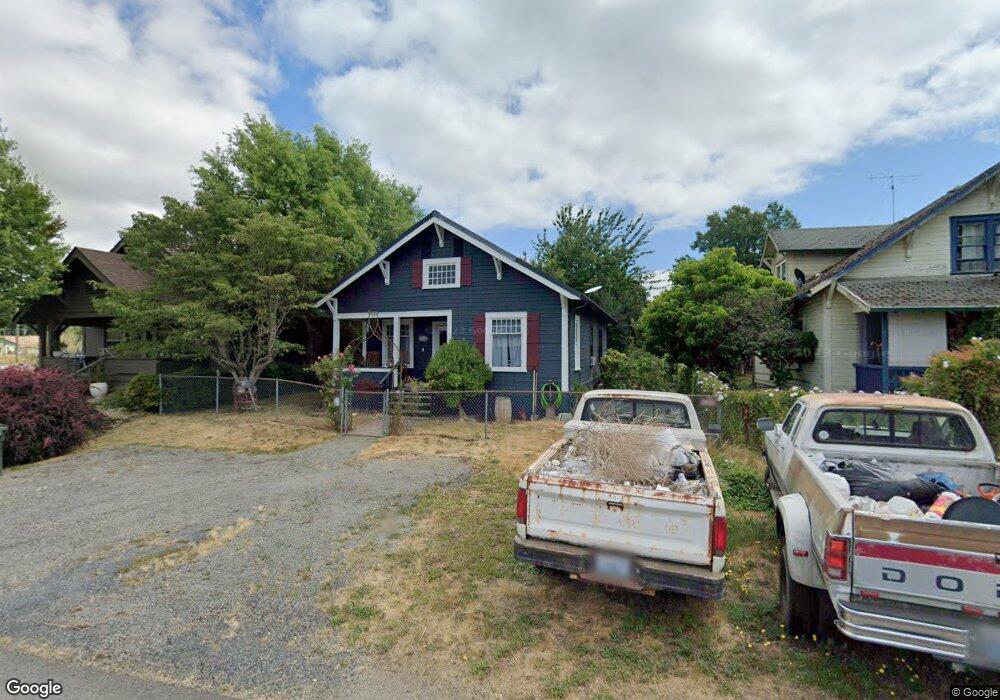
This home is located at 718 Main St, Vader, WA 98593 and is currently estimated at $259,604, approximately $264 per square foot. 718 Main St is a home with nearby schools including Castle Rock Elementary School, Castle Rock Middle School, and Castle Rock High School.
Ownership History
We collect this data history from publicly available records. To have your information removed, we recommend requesting removal directly through your county’s website.
Purchase Details
Home Financials for this Owner
Home Financials are based on the most recent Mortgage that was taken out on this home.Purchase History
We collect this data history from publicly available records. To have your information removed, we recommend requesting removal directly through your county’s website.
| Date | Buyer | Sale Price | Title Company |
|---|---|---|---|
| $95,000 | None Available |
Mortgage History
We collect this data history from publicly available records. To have your information removed, we recommend requesting removal directly through your county’s website.
| Date | Status | Borrower | Loan Amount |
|---|---|---|---|
| Open | $80,750 |
Tax History
We collect this data history from publicly available records. To have your information removed, we recommend requesting removal directly through your county’s website.
| Year | Tax Paid | Tax Assessment Tax Assessment Total Assessment is a certain percentage of the fair market value that is determined by local assessors to be the total taxable value of land and additions on the property. | Land | Improvement |
|---|---|---|---|---|
| 2025 | $1,455 | $192,200 | $56,900 | $135,300 |
| 2024 | $1,455 | $186,000 | $50,700 | $135,300 |
| 2023 | $1,256 | $176,700 | $41,400 | $135,300 |
| 2022 | $1,204 | $145,000 | $32,600 | $112,400 |
| 2021 | $1,107 | $145,000 | $32,600 | $112,400 |
| 2020 | $36 | $121,700 | $28,500 | $93,200 |
| 2019 | $34 | $66,100 | $16,400 | $49,700 |
| 2018 | $28 | $60,900 | $15,000 | $45,900 |
| 2017 | $19 | $56,000 | $15,000 | $41,000 |
| 2016 | $17 | $52,300 | $15,000 | $37,300 |
| 2015 | $32 | $46,900 | $13,000 | $33,900 |
| 2013 | $32 | $64,400 | $33,200 | $31,200 |
Map
- 817 B St
- 1899 Washington 506
- 0 9th St Unit 536129945
- 0 9th St Unit NWM2543007
- 416 Main St
- 818 D St
- 1017 C St
- 402 A St
- 0 E St Unit NWM2543008
- 0 E St Unit 414322827
- 810 F St
- 821 G St
- 1110 D St
- 805 G St
- 5 Endor Heights Ct
- 1 Endor Heights Ct
- 8 Endor Heights Ct
- 3 Endor Heights Ct
- 6 Endor Heights Ct
- 7 Endor Heights Ct
Ask me questions while you tour the home.