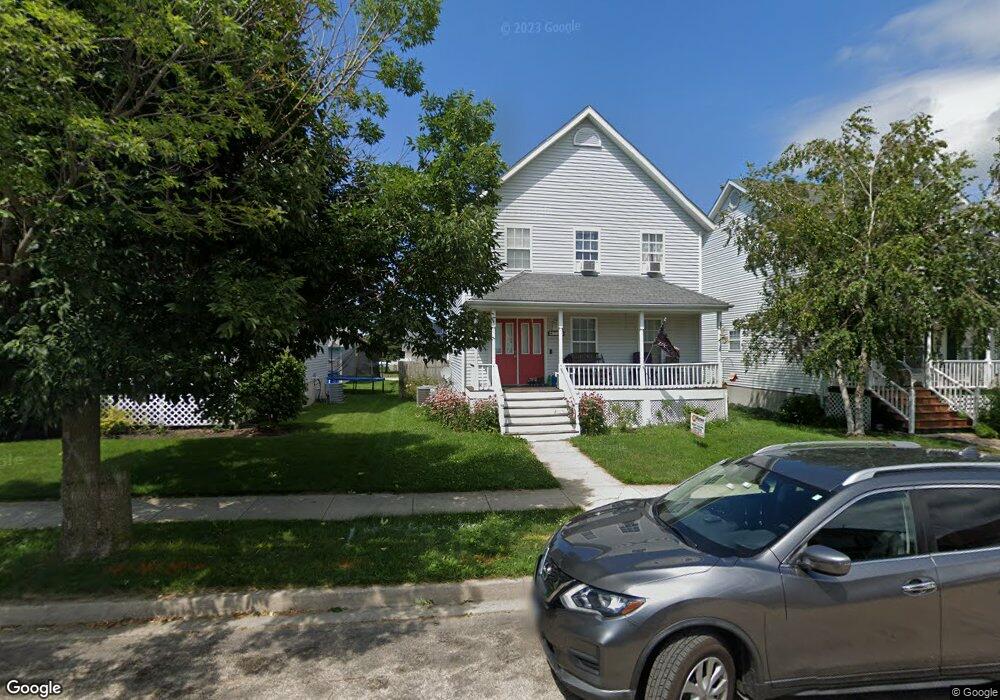
719 Benham St Kirkland, IL 60146
Estimated Value: $258,827 - $267,000
3
Beds
3
Baths
1,650
Sq Ft
$159/Sq Ft
Est. Value
About This Home
This home is located at 719 Benham St, Kirkland, IL 60146 and is currently estimated at $261,707, approximately $158 per square foot. 719 Benham St is a home located in DeKalb County with nearby schools including Hiawatha Elementary School and Hiawatha Jr./Sr. High School.
Ownership History
Date
Name
Owned For
Owner Type
Purchase Details
Closed on
Jul 19, 2009
Sold by
Long Jason R
Bought by
Chambers Mark A and Chambers Michelle L
Current Estimated Value
Home Financials for this Owner
Home Financials are based on the most recent Mortgage that was taken out on this home.
Original Mortgage
$146,301
Outstanding Balance
$96,066
Interest Rate
5.43%
Mortgage Type
FHA
Estimated Equity
$165,641
Create a Home Valuation Report for This Property
The Home Valuation Report is an in-depth analysis detailing your home's value as well as a comparison with similar homes in the area
Home Values in the Area
Average Home Value in this Area
Purchase History
| Date | Buyer | Sale Price | Title Company |
|---|---|---|---|
| Chambers Mark A | $149,000 | -- |
Source: Public Records
Mortgage History
| Date | Status | Borrower | Loan Amount |
|---|---|---|---|
| Open | Chambers Mark A | $146,301 |
Source: Public Records
Tax History
| Year | Tax Paid | Tax Assessment Tax Assessment Total Assessment is a certain percentage of the fair market value that is determined by local assessors to be the total taxable value of land and additions on the property. | Land | Improvement |
|---|---|---|---|---|
| 2025 | $5,852 | $73,153 | $9,765 | $63,388 |
| 2024 | $5,508 | $67,671 | $9,033 | $58,638 |
| 2023 | $5,508 | $62,329 | $8,320 | $54,009 |
| 2022 | $5,381 | $60,696 | $8,102 | $52,594 |
| 2021 | $4,903 | $53,910 | $7,811 | $46,099 |
| 2020 | $4,719 | $51,177 | $7,415 | $43,762 |
| 2019 | $4,641 | $49,672 | $7,197 | $42,475 |
| 2018 | $4,249 | $45,777 | $6,992 | $38,785 |
| 2017 | $4,130 | $44,626 | $6,816 | $37,810 |
| 2016 | $4,095 | $43,623 | $6,663 | $36,960 |
| 2015 | -- | $40,941 | $6,253 | $34,688 |
| 2014 | -- | $44,942 | $5,782 | $39,160 |
| 2013 | -- | $46,251 | $5,950 | $40,301 |
Source: Public Records
Map
Nearby Homes
Your Personal Tour Guide
Ask me questions while you tour the home.