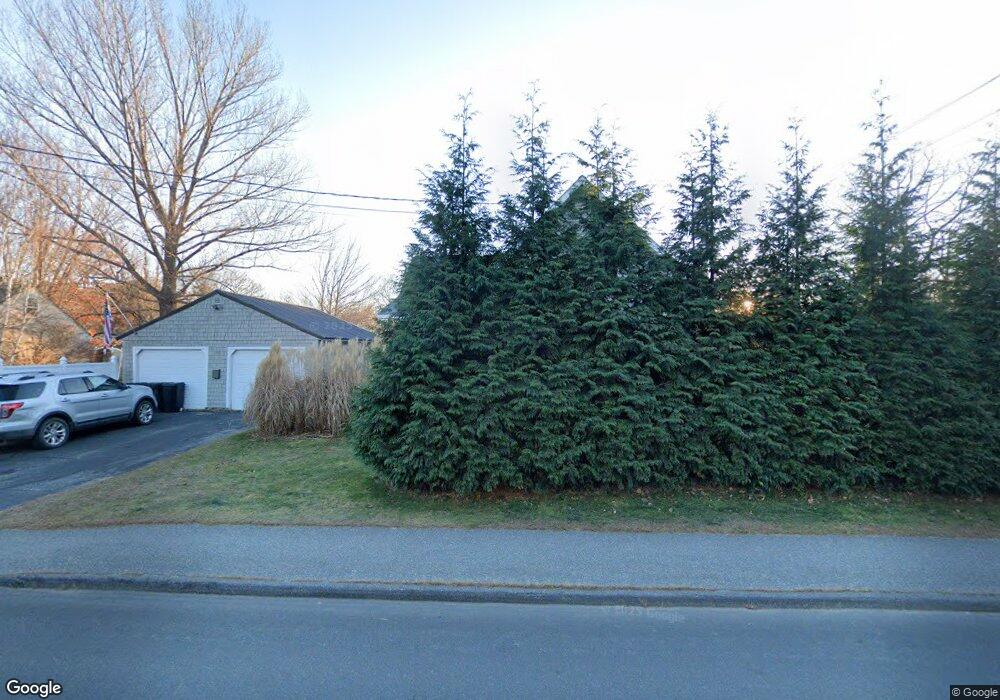
72 Bridge St Topsham, ME 04086
Estimated Value: $427,000 - $497,000
About This Home
This home is located at 72 Bridge St, Topsham, ME 04086 and is currently estimated at $464,067, approximately $299 per square foot. 72 Bridge St is a home located in Sagadahoc County with nearby schools including Mt Ararat High School, Harpswell Coastal Academy Divisions 2 and 3, and St John's Catholic School.
Ownership History
We collect this data history from publicly available records. To have your information removed, we recommend requesting removal directly through your county’s website.
Purchase Details
Home Financials for this Owner
Home Financials are based on the most recent Mortgage that was taken out on this home.Home Values in the Area
Average Home Value in this Area
Purchase History
We collect this data history from publicly available records. To have your information removed, we recommend requesting removal directly through your county’s website.
| Date | Buyer | Sale Price | Title Company |
|---|---|---|---|
| -- | -- |
Mortgage History
We collect this data history from publicly available records. To have your information removed, we recommend requesting removal directly through your county’s website.
| Date | Status | Borrower | Loan Amount |
|---|---|---|---|
| Closed | $114,000 |
Tax History
We collect this data history from publicly available records. To have your information removed, we recommend requesting removal directly through your county’s website.
| Year | Tax Paid | Tax Assessment Tax Assessment Total Assessment is a certain percentage of the fair market value that is determined by local assessors to be the total taxable value of land and additions on the property. | Land | Improvement |
|---|---|---|---|---|
| 2025 | $5,527 | $431,800 | $86,600 | $345,200 |
| 2024 | $5,398 | $431,800 | $80,300 | $351,500 |
| 2023 | $5,242 | $386,000 | $76,600 | $309,400 |
| 2022 | $4,571 | $317,000 | $71,000 | $246,000 |
| 2021 | $4,432 | $279,300 | $65,100 | $214,200 |
| 2020 | $4,508 | $252,400 | $65,100 | $187,300 |
| 2019 | $4,328 | $226,000 | $62,500 | $163,500 |
| 2018 | $4,019 | $214,600 | $48,900 | $165,700 |
| 2017 | $3,889 | $214,600 | $48,900 | $165,700 |
| 2016 | $3,799 | $211,200 | $48,900 | $162,300 |
| 2015 | $3,671 | $204,400 | $48,900 | $155,500 |
| 2014 | $3,424 | $197,600 | $48,900 | $148,700 |
| 2013 | $3,290 | $197,600 | $48,900 | $148,700 |
Map
- 48 Winter St
- 29 Winter St
- 10 Maple Street Extension
- 21 Bickford Dr
- 67 Winter St
- 7 Garnet Dr Unit 29
- 16 Beryl Loop Unit 16
- 16 Main St
- 29 Forest Glen Ln
- 0 Mill St
- 118 Main St
- 19 Forest Glen Ln
- 23 Forest Glen Ln
- 11 Lincoln St
- 16 Dunlap St
- 57 Barrows Dr
- 69 Barrows Dr
- 25 School St
- 7 Ballard St
- 86 Merrymeeting Rd
Ask me questions while you tour the home.