72 Collier Rd Sycamore, GA 31790
Estimated Value: $74,237
2
Beds
1
Bath
925
Sq Ft
$80/Sq Ft
Est. Value
About This Home
This home is located at 72 Collier Rd, Sycamore, GA 31790 and is currently estimated at $74,237, approximately $80 per square foot. 72 Collier Rd is a home located in Tift County with nearby schools including Len Lastinger Primary School, Matt Wilson Elementary School, and J.T. Reddick School.
Create a Home Valuation Report for This Property
The Home Valuation Report is an in-depth analysis detailing your home's value as well as a comparison with similar homes in the area
Tax History
| Year | Tax Paid | Tax Assessment Tax Assessment Total Assessment is a certain percentage of the fair market value that is determined by local assessors to be the total taxable value of land and additions on the property. | Land | Improvement |
|---|---|---|---|---|
| 2025 | $367 | $16,825 | $6,871 | $9,954 |
| 2024 | $499 | $16,825 | $6,871 | $9,954 |
| 2023 | $496 | $16,702 | $6,800 | $9,902 |
| 2022 | $430 | $14,484 | $6,800 | $7,684 |
| 2021 | $432 | $14,484 | $6,800 | $7,684 |
| 2020 | $431 | $14,170 | $6,800 | $7,370 |
| 2019 | $430 | $14,170 | $6,800 | $7,370 |
| 2018 | $430 | $14,170 | $6,800 | $7,370 |
| 2017 | $432 | $14,170 | $6,800 | $7,370 |
| 2016 | $432 | $14,170 | $6,800 | $7,370 |
| 2015 | $202 | $14,170 | $6,800 | $7,370 |
| 2014 | $202 | $14,170 | $6,800 | $7,370 |
| 2013 | -- | $0 | $0 | $0 |
Source: Public Records
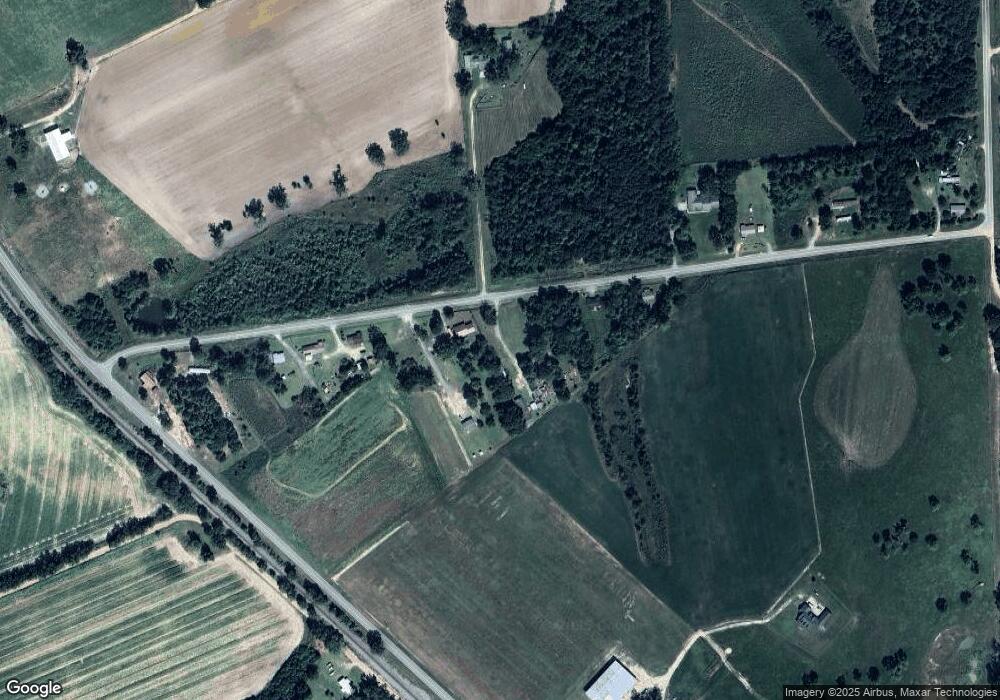
Map
Nearby Homes
- 650 Clyatt Rd
- 0 Whiddon Mill Rd Unit 138931
- 136 S Access Rd
- 625 Willis Rd
- 320 S Mattie Ave
- 277 Wesley Rigdon Rd
- 2633 US Hwy 41
- 746 Chula Brookfield Rd
- 196 N Mattie Ave
- 196 N Mattie Ave Unit 9-10-11
- 1441 Bussey Rd
- 1511 Bussey Rd
- 50 Hank Mike Rd
- 41 W Collins St
- 883 N Railroad Ave
- 87 Waterfront St
- 7203 Doss Dr
- 142 Brighton Rd
- 100 Long Pine Rd
- W Hutchinson Rd
Your Personal Tour Guide
Ask me questions while you tour the home.