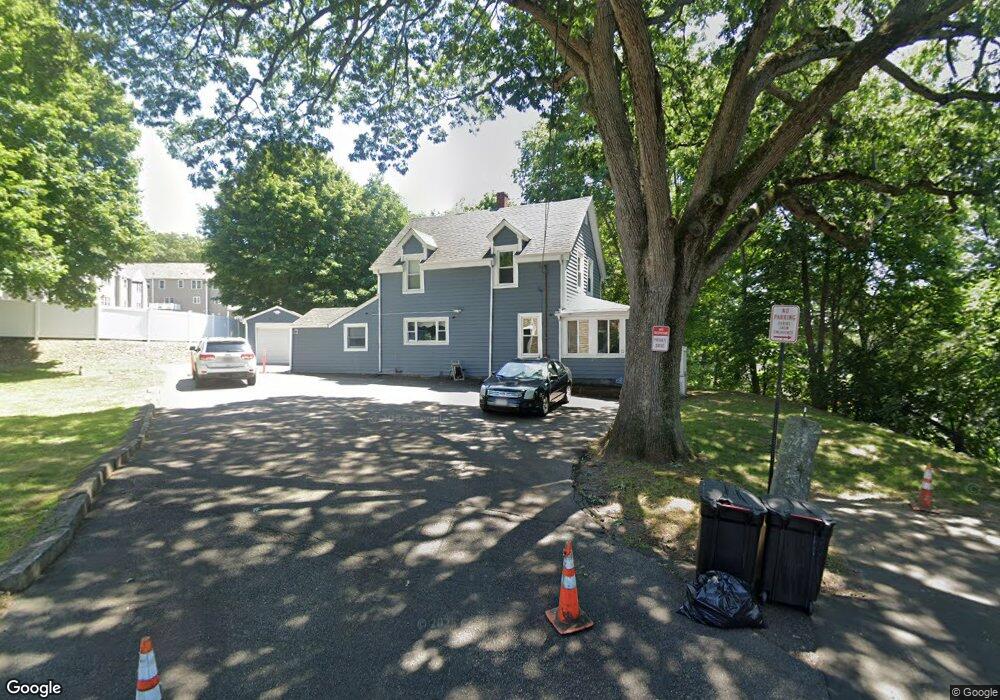
72 Filbert St Quincy, MA 02169
South Quincy NeighborhoodEstimated Value: $717,000 - $768,261
3
Beds
2
Baths
1,610
Sq Ft
$461/Sq Ft
Est. Value
About This Home
This home is located at 72 Filbert St, Quincy, MA 02169 and is currently estimated at $742,565, approximately $461 per square foot. 72 Filbert St is a home located in Norfolk County with nearby schools including Lincoln-Hancock Community School, South West Middle School, and Quincy High School.
Ownership History
Date
Name
Owned For
Owner Type
Purchase Details
Closed on
Oct 28, 2009
Sold by
Fernandez Frances L and Fernandez James P
Bought by
Hall Angela
Current Estimated Value
Home Financials for this Owner
Home Financials are based on the most recent Mortgage that was taken out on this home.
Original Mortgage
$299,475
Outstanding Balance
$191,345
Interest Rate
5.06%
Mortgage Type
Purchase Money Mortgage
Estimated Equity
$551,220
Create a Home Valuation Report for This Property
The Home Valuation Report is an in-depth analysis detailing your home's value as well as a comparison with similar homes in the area
Home Values in the Area
Average Home Value in this Area
Purchase History
| Date | Buyer | Sale Price | Title Company |
|---|---|---|---|
| Hall Angela | $305,000 | -- |
Source: Public Records
Mortgage History
| Date | Status | Borrower | Loan Amount |
|---|---|---|---|
| Open | Hall Angela | $299,475 |
Source: Public Records
Tax History
| Year | Tax Paid | Tax Assessment Tax Assessment Total Assessment is a certain percentage of the fair market value that is determined by local assessors to be the total taxable value of land and additions on the property. | Land | Improvement |
|---|---|---|---|---|
| 2025 | $7,445 | $645,700 | $325,400 | $320,300 |
| 2024 | $6,973 | $618,700 | $310,600 | $308,100 |
| 2023 | $6,549 | $588,400 | $296,500 | $291,900 |
| 2022 | $6,401 | $534,300 | $239,800 | $294,500 |
| 2021 | $6,081 | $500,900 | $239,800 | $261,100 |
| 2020 | $6,060 | $487,500 | $239,800 | $247,700 |
| 2019 | $5,984 | $476,800 | $233,300 | $243,500 |
| 2018 | $5,774 | $432,800 | $217,000 | $215,800 |
| 2017 | $5,774 | $407,500 | $207,300 | $200,200 |
| 2016 | $5,388 | $375,200 | $189,700 | $185,500 |
| 2015 | $5,106 | $349,700 | $179,700 | $170,000 |
| 2014 | $4,953 | $333,300 | $179,700 | $153,600 |
Source: Public Records
Map
Nearby Homes
- 40 Cross St Unit 1
- 39 Cross St
- 211 Copeland St
- 12 Nelson St
- 84 West St Unit 1
- 1 Cityview Ln Unit 707
- 21 Arthur St
- 9 Westford St
- 510 Willard St
- 230 Willard St Unit 102
- 230 Willard St Unit 207
- 156 West St
- 132 Centre St
- 91 Garfield St
- 211 West St Unit 11B
- 211 West St Unit 12B
- 149 Reservoir Rd
- 52 Packards Ln Unit 4
- 165 Whitwell St
- 59 Packards Ln Unit 5
- 64 Filbert St
- 206 Common St
- 212 Common St
- 202 Common St
- 145 Suomi Rd Unit C9
- 145 Suomi Rd Unit C8
- 145 Suomi Rd Unit B6
- 145 Suomi Rd Unit B5
- 145 Suomi Rd Unit B4
- 145 Suomi Rd Unit A3
- 145 Suomi Rd Unit A2
- 145 Suomi Rd Unit A1
- 145 Suomi Rd Unit 7
- 145 Suomi Rd Unit 1
- 145 Suomi Rd Unit 5
- 145 Suomi Rd Unit 3
- 145 Suomi Rd Unit 3,145A
- 145 Suomi Rd Unit 4,145B
- 145 Suomi Rd Unit 4
- 145 Suomi Rd Unit 6
Your Personal Tour Guide
Ask me questions while you tour the home.