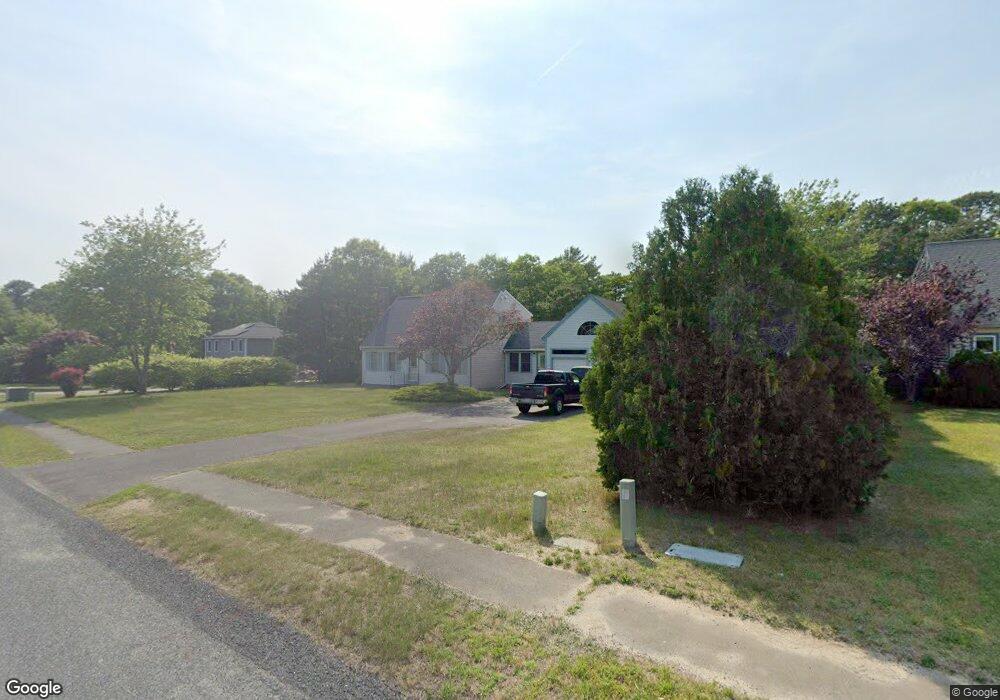
72 Joyce Dr Plymouth, MA 02360
Estimated Value: $535,063 - $616,000
2
Beds
2
Baths
1,152
Sq Ft
$499/Sq Ft
Est. Value
About This Home
This home is located at 72 Joyce Dr, Plymouth, MA 02360 and is currently estimated at $575,016, approximately $499 per square foot. 72 Joyce Dr is a home located in Plymouth County with nearby schools including South Elementary School, Plymouth South Middle School, and Plymouth South High School.
Ownership History
Date
Name
Owned For
Owner Type
Purchase Details
Closed on
Jul 19, 1993
Sold by
Maughan Deborah
Bought by
Chaples John F
Current Estimated Value
Purchase Details
Closed on
Jun 9, 1989
Sold by
Pond Properties Inc
Bought by
Chaples John
Create a Home Valuation Report for This Property
The Home Valuation Report is an in-depth analysis detailing your home's value as well as a comparison with similar homes in the area
Home Values in the Area
Average Home Value in this Area
Purchase History
| Date | Buyer | Sale Price | Title Company |
|---|---|---|---|
| Chaples John F | $5,000 | -- | |
| Chaples John F | $5,000 | -- | |
| Chaples John | $124,900 | -- | |
| Chaples John | $124,900 | -- |
Source: Public Records
Mortgage History
| Date | Status | Borrower | Loan Amount |
|---|---|---|---|
| Open | Chaples John | $180,000 | |
| Closed | Chaples John | $40,000 | |
| Closed | Chaples John | $130,000 |
Source: Public Records
Tax History
| Year | Tax Paid | Tax Assessment Tax Assessment Total Assessment is a certain percentage of the fair market value that is determined by local assessors to be the total taxable value of land and additions on the property. | Land | Improvement |
|---|---|---|---|---|
| 2025 | $6,112 | $481,600 | $206,800 | $274,800 |
| 2024 | $5,964 | $463,400 | $196,800 | $266,600 |
| 2023 | $5,857 | $427,200 | $178,800 | $248,400 |
| 2022 | $5,493 | $356,000 | $163,400 | $192,600 |
| 2021 | $5,305 | $328,300 | $163,400 | $164,900 |
| 2020 | $4,975 | $304,300 | $163,400 | $140,900 |
| 2019 | $4,803 | $290,400 | $148,400 | $142,000 |
| 2018 | $4,607 | $279,900 | $138,400 | $141,500 |
| 2017 | $4,385 | $264,500 | $138,400 | $126,100 |
| 2016 | $4,154 | $255,300 | $128,400 | $126,900 |
| 2015 | $3,824 | $246,100 | $118,400 | $127,700 |
| 2014 | $3,668 | $242,400 | $118,400 | $124,000 |
Source: Public Records
Map
Nearby Homes
- 2 Daniel Cir
- 25 Noreast Ln
- 7 Central Ave
- 42 Arbor Ridge
- 10 Oriole Way
- 7 Lake View Blvd
- 20 Nicholas Ave
- 7 Tadpole Way
- 4 Tadpole Way
- 10 Shore Rd
- 110 Valley Rd
- 53 Carters Bridge Rd
- 23 Stone Dr
- 2 Gabriel Ln
- 31 Waterview Way
- 29 White Clover Trail
- 31 Inkberry Ln
- 29 Eagle Hill Dr
- 21 Hillside Rd
- 20 Daisy Ln
Your Personal Tour Guide
Ask me questions while you tour the home.