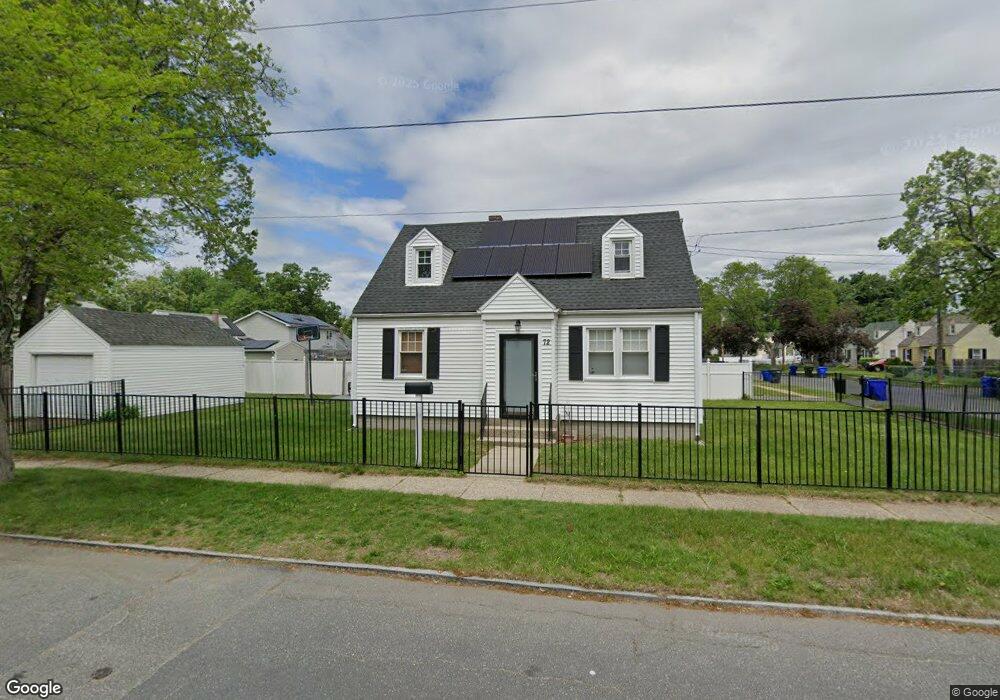
72 Pear St Springfield, MA 01109
Pine Point NeighborhoodEstimated Value: $263,638 - $301,000
3
Beds
1
Bath
1,008
Sq Ft
$285/Sq Ft
Est. Value
About This Home
This home is located at 72 Pear St, Springfield, MA 01109 and is currently estimated at $287,660, approximately $285 per square foot. 72 Pear St is a home located in Hampden County with nearby schools including Frank H. Freedman School, John J Duggan Middle, and Springfield Central High School.
Ownership History
Date
Name
Owned For
Owner Type
Purchase Details
Closed on
Jul 18, 2016
Sold by
Garcia Nelson
Bought by
Feliciano Tonika
Current Estimated Value
Home Financials for this Owner
Home Financials are based on the most recent Mortgage that was taken out on this home.
Original Mortgage
$132,554
Outstanding Balance
$102,771
Interest Rate
3.66%
Mortgage Type
FHA
Estimated Equity
$184,889
Purchase Details
Closed on
Feb 3, 2016
Sold by
Gauthier Isabelle Est and Gauthier
Bought by
Garcia Nelson
Create a Home Valuation Report for This Property
The Home Valuation Report is an in-depth analysis detailing your home's value as well as a comparison with similar homes in the area
Home Values in the Area
Average Home Value in this Area
Purchase History
| Date | Buyer | Sale Price | Title Company |
|---|---|---|---|
| Feliciano Tonika | $135,000 | -- | |
| Garcia Nelson | $45,000 | -- |
Source: Public Records
Mortgage History
| Date | Status | Borrower | Loan Amount |
|---|---|---|---|
| Open | Feliciano Tonika | $132,554 |
Source: Public Records
Tax History
| Year | Tax Paid | Tax Assessment Tax Assessment Total Assessment is a certain percentage of the fair market value that is determined by local assessors to be the total taxable value of land and additions on the property. | Land | Improvement |
|---|---|---|---|---|
| 2025 | $3,702 | $236,100 | $39,300 | $196,800 |
| 2024 | $3,715 | $231,300 | $32,800 | $198,500 |
| 2023 | $3,219 | $188,800 | $29,800 | $159,000 |
| 2022 | $3,292 | $174,900 | $27,800 | $147,100 |
| 2021 | $2,945 | $155,800 | $25,300 | $130,500 |
| 2020 | $2,840 | $145,400 | $25,300 | $120,100 |
| 2019 | $2,588 | $131,500 | $25,300 | $106,200 |
| 2018 | $2,610 | $132,600 | $25,300 | $107,300 |
| 2017 | $2,090 | $106,300 | $23,400 | $82,900 |
| 2016 | $1,919 | $97,600 | $23,400 | $74,200 |
| 2015 | $1,877 | $95,400 | $23,400 | $72,000 |
Source: Public Records
Map
Nearby Homes
- 266 Rosewell St
- 0 Herbert Ave
- 0 Herbert Ave
- 62 Pear St
- 262 Rosewell St
- 245 Breckwood Blvd
- 286 Rosewell St
- 241 Breckwood Blvd
- 61 Pear St
- 271 Rosewell St
- 265 Rosewell St
- 281 Rosewell St
- 235 Breckwood Blvd
- 261 Rosewell St
- 252 Rosewell St
- 265 Breckwood Blvd
- 292 Rosewell St
- 285 Rosewell St
- 255 Rosewell St
- 231 Breckwood Blvd
Your Personal Tour Guide
Ask me questions while you tour the home.