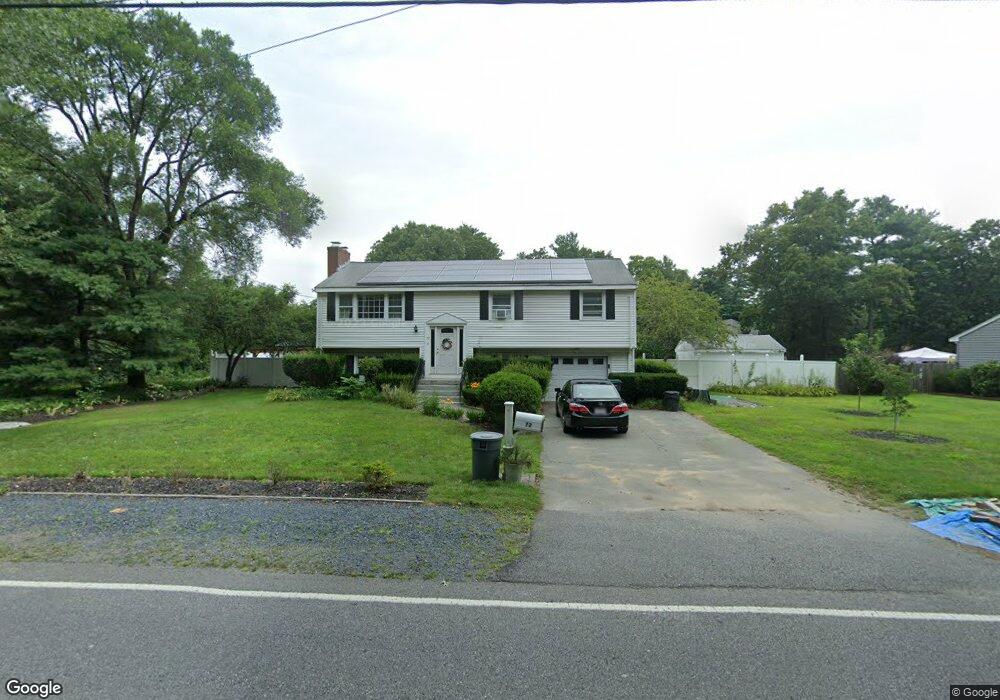
72 Pine St Natick, MA 01760
Estimated Value: $832,000 - $977,000
3
Beds
3
Baths
1,526
Sq Ft
$585/Sq Ft
Est. Value
About This Home
This home is located at 72 Pine St, Natick, MA 01760 and is currently estimated at $892,742, approximately $585 per square foot. 72 Pine St is a home located in Middlesex County with nearby schools including Natick High School, Bennett-Hemenway (Ben-Hem) Elementary School, and Wilson Middle School.
Ownership History
Date
Name
Owned For
Owner Type
Purchase Details
Closed on
Mar 9, 1999
Sold by
Melia James M and Melia Jean E
Bought by
Blanch Randall J and Blanch Reginalde N
Current Estimated Value
Home Financials for this Owner
Home Financials are based on the most recent Mortgage that was taken out on this home.
Original Mortgage
$226,450
Interest Rate
6.76%
Mortgage Type
Purchase Money Mortgage
Create a Home Valuation Report for This Property
The Home Valuation Report is an in-depth analysis detailing your home's value as well as a comparison with similar homes in the area
Home Values in the Area
Average Home Value in this Area
Purchase History
| Date | Buyer | Sale Price | Title Company |
|---|---|---|---|
| Blanch Randall J | $238,400 | -- |
Source: Public Records
Mortgage History
| Date | Status | Borrower | Loan Amount |
|---|---|---|---|
| Open | Blanch Randall J | $320,000 | |
| Closed | Blanch Randall J | $50,000 | |
| Closed | Blanch Randall J | $13,000 | |
| Closed | Blanch Randall J | $226,450 |
Source: Public Records
Tax History
| Year | Tax Paid | Tax Assessment Tax Assessment Total Assessment is a certain percentage of the fair market value that is determined by local assessors to be the total taxable value of land and additions on the property. | Land | Improvement |
|---|---|---|---|---|
| 2025 | $8,792 | $735,100 | $448,200 | $286,900 |
| 2024 | $8,507 | $693,900 | $421,800 | $272,100 |
| 2023 | $8,457 | $669,100 | $403,800 | $265,300 |
| 2022 | $8,131 | $609,500 | $365,200 | $244,300 |
| 2021 | $7,681 | $564,400 | $344,400 | $220,000 |
| 2020 | $7,468 | $548,700 | $328,700 | $220,000 |
| 2019 | $6,974 | $548,700 | $328,700 | $220,000 |
| 2018 | $6,355 | $487,000 | $313,100 | $173,900 |
| 2017 | $5,961 | $441,900 | $271,300 | $170,600 |
| 2016 | $5,690 | $419,300 | $250,300 | $169,000 |
| 2015 | $5,605 | $405,600 | $250,300 | $155,300 |
Source: Public Records
Map
Nearby Homes
- 14 Drury Ln
- 8 Liberty St
- 29 Irving Rd
- 5 Bradford Rd
- 4 Richard Rd
- 1 Richard Rd
- 25 Irving Rd
- 340 N Main St
- 48 Wethersfield Rd
- 50 Wethersfield Rd
- 136 Commonwealth Rd
- 278 N Main St
- 6 Cypress Rd
- 201 Willow Brook Dr
- 6 Ash St
- 37 Longfellow Rd
- 8 Arlington Cir
- 26 Longfellow Rd
- 45 W Plain St Unit 1
- 186 Main St
Your Personal Tour Guide
Ask me questions while you tour the home.