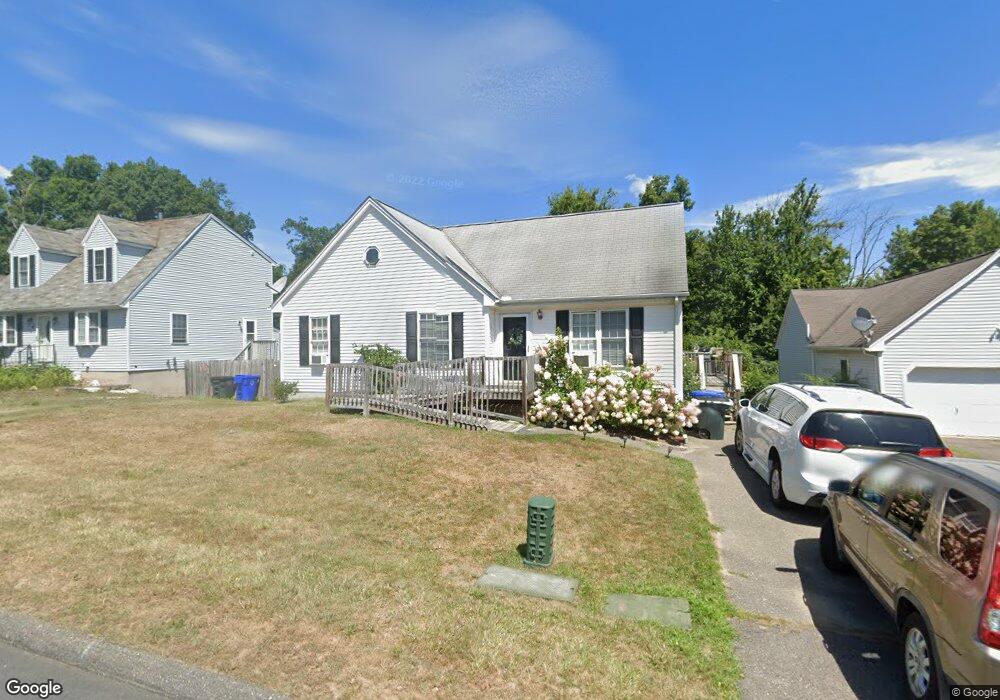
72 Pondside Ln Torrington, CT 06790
Torrington AreaEstimated Value: $283,000 - $336,000
About This Home
This home is located at 72 Pondside Ln, Torrington, CT 06790 and is currently estimated at $308,661, approximately $299 per square foot. 72 Pondside Ln is a home located in Litchfield County with nearby schools including Torrington Middle School, Torrington High School, and St. Peter School.
Ownership History
We collect this data history from publicly available records. To have your information removed, we recommend requesting removal directly through your county’s website.
Purchase Details
Home Financials for this Owner
Home Financials are based on the most recent Mortgage that was taken out on this home.Home Values in the Area
Average Home Value in this Area
Purchase History
We collect this data history from publicly available records. To have your information removed, we recommend requesting removal directly through your county’s website.
| Date | Buyer | Sale Price | Title Company |
|---|---|---|---|
| $172,500 | -- |
Mortgage History
We collect this data history from publicly available records. To have your information removed, we recommend requesting removal directly through your county’s website.
| Date | Status | Borrower | Loan Amount |
|---|---|---|---|
| Open | $130,000 | ||
| Closed | $10,150 | ||
| Previous Owner | $18,300 |
Tax History
We collect this data history from publicly available records. To have your information removed, we recommend requesting removal directly through your county’s website.
| Year | Tax Paid | Tax Assessment Tax Assessment Total Assessment is a certain percentage of the fair market value that is determined by local assessors to be the total taxable value of land and additions on the property. | Land | Improvement |
|---|---|---|---|---|
| 2025 | $6,686 | $173,880 | $23,520 | $150,360 |
| 2024 | $4,439 | $92,530 | $23,520 | $69,010 |
| 2023 | $4,438 | $92,530 | $23,520 | $69,010 |
| 2022 | $4,362 | $92,530 | $23,520 | $69,010 |
| 2021 | $4,272 | $92,530 | $23,520 | $69,010 |
| 2020 | $4,272 | $92,530 | $23,520 | $69,010 |
| 2019 | $4,905 | $106,240 | $28,900 | $77,340 |
| 2018 | $4,905 | $106,240 | $28,900 | $77,340 |
| 2017 | $4,860 | $106,240 | $28,900 | $77,340 |
| 2016 | $4,860 | $106,240 | $28,900 | $77,340 |
| 2015 | $4,832 | $105,620 | $28,900 | $76,720 |
| 2014 | $4,239 | $116,720 | $46,910 | $69,810 |
Map
- 42 Pondside Ln
- 349 Allen Rd Unit 45D
- 68 Westledge Terrace
- 559 Allen Rd
- 20 Lawrence Ln
- 401 Highland Ave
- 205 Oakbrook Ln
- 305 Westledge Dr
- 24 Zappula Dr
- 425 Westledge Dr
- 243 Roberts St
- 437 Westledge Dr
- 28 Birden St
- 229 Wimbledon Gate N
- 17 Hawthorne Terrace
- 112 Greenfield Dr
- 169 Central Ave
- 84 Chestnut Ave
- 141 Riverside Ave
- 187 Lovers Ln Unit 41
Ask me questions while you tour the home.