72 Poole Cir Holbrook, MA 02343
Estimated Value: $391,000 - $548,000
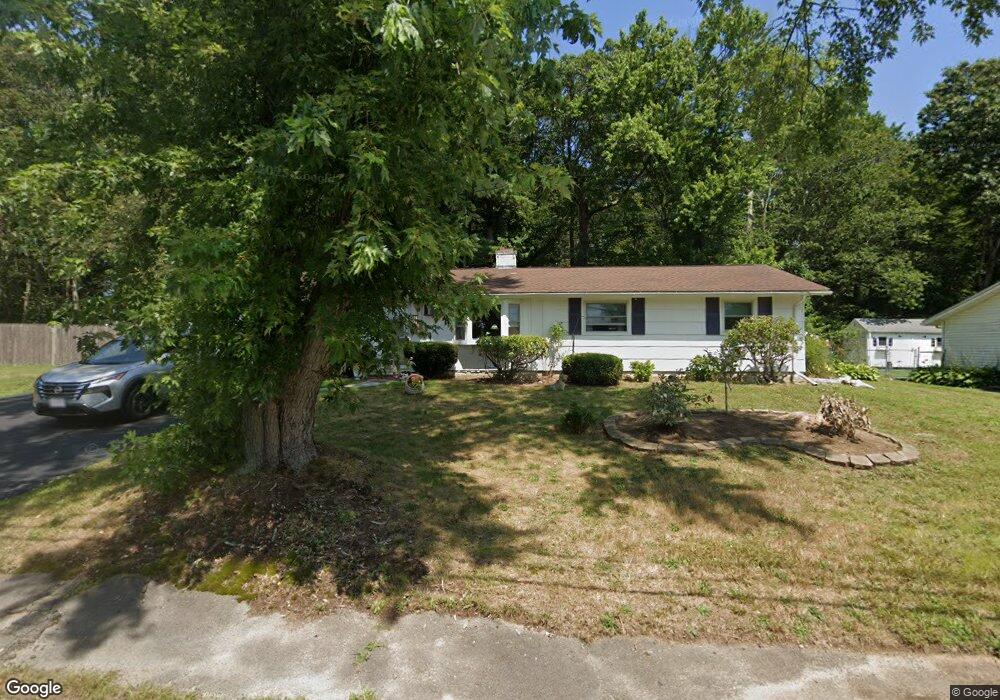
About This Home
This home is located at 72 Poole Cir, Holbrook, MA 02343 and is currently estimated at $485,510, approximately $356 per square foot. 72 Poole Cir is a home located in Norfolk County with nearby schools including John F. Kennedy Elementary School, Holbrook Middle High School, and Boston Higashi School.
Ownership History
We collect this data history from publicly available records. To have your information removed, we recommend requesting removal directly through your county’s website.
Purchase Details
Purchase Details
Purchase Details
Purchase Details
Home Values in the Area
Average Home Value in this Area
Purchase History
We collect this data history from publicly available records. To have your information removed, we recommend requesting removal directly through your county’s website.
| Date | Buyer | Sale Price | Title Company |
|---|---|---|---|
| -- | None Available | ||
| -- | None Available | ||
| -- | None Available | ||
| -- | None Available | ||
| -- | None Available | ||
| -- | None Available | ||
| -- | -- | ||
| -- | -- | ||
| -- | -- | ||
| $92,500 | -- |
Mortgage History
We collect this data history from publicly available records. To have your information removed, we recommend requesting removal directly through your county’s website.
| Date | Status | Borrower | Loan Amount |
|---|---|---|---|
| Previous Owner | $175,000 | ||
| Previous Owner | $27,000 | ||
| Previous Owner | $108,000 |
Tax History
We collect this data history from publicly available records. To have your information removed, we recommend requesting removal directly through your county’s website.
| Year | Tax Paid | Tax Assessment Tax Assessment Total Assessment is a certain percentage of the fair market value that is determined by local assessors to be the total taxable value of land and additions on the property. | Land | Improvement |
|---|---|---|---|---|
| 2025 | $56 | $423,800 | $248,200 | $175,600 |
| 2024 | $5,281 | $392,900 | $225,600 | $167,300 |
| 2023 | $5,584 | $363,100 | $205,200 | $157,900 |
| 2022 | $5,171 | $313,600 | $178,400 | $135,200 |
| 2021 | $5,016 | $291,300 | $163,400 | $127,900 |
| 2020 | $4,943 | $269,100 | $152,800 | $116,300 |
| 2019 | $4,978 | $255,800 | $145,500 | $110,300 |
| 2018 | $4,884 | $236,300 | $130,000 | $106,300 |
| 2017 | $4,611 | $220,600 | $118,300 | $102,300 |
| 2016 | $4,215 | $214,600 | $118,300 | $96,300 |
| 2015 | $3,782 | $198,200 | $106,700 | $91,500 |
| 2014 | $3,450 | $183,800 | $97,000 | $86,800 |
Map
- 167 Sycamore St
- 45 Ernest St
- 288 Weymouth St
- 289 Weymouth St
- 12 Chesapeake Rd
- 4 Bruce Rd
- 354 Sycamore St
- 43 Plymouth St
- 640 Plymouth St
- 148 N Franklin St
- 14 Elm Ave
- 266 N Franklin St Unit 266A
- 49 Pleasant St
- 3 Rindone St
- 39 Marion St
- 42 Fern Rd
- 1696 Liberty St
- 27 Morgan Rd
- 5 Clarendon Cir
- 484 S Franklin St
Ask me questions while you tour the home.