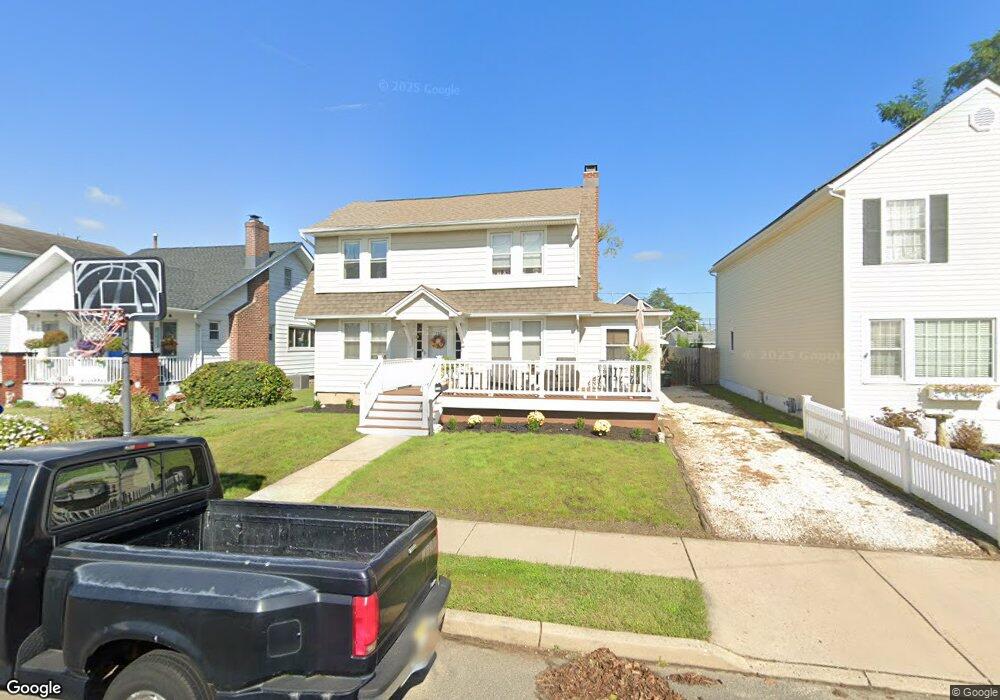
720 20th Ave Belmar, NJ 07719
Estimated Value: $753,000 - $938,251
3
Beds
1
Bath
1,406
Sq Ft
$571/Sq Ft
Est. Value
About This Home
This home is located at 720 20th Ave, Belmar, NJ 07719 and is currently estimated at $803,313, approximately $571 per square foot. 720 20th Ave is a home located in Monmouth County with nearby schools including St. Rose Grammar School and St Rose High School.
Ownership History
Date
Name
Owned For
Owner Type
Purchase Details
Closed on
May 29, 1997
Sold by
Barnes Christopher
Bought by
Ricca Stephen and Ricca Margaret
Current Estimated Value
Home Financials for this Owner
Home Financials are based on the most recent Mortgage that was taken out on this home.
Original Mortgage
$85,000
Outstanding Balance
$12,163
Interest Rate
7.98%
Estimated Equity
$791,150
Purchase Details
Closed on
May 17, 1994
Sold by
Schmidt Donald
Bought by
Barnes Christopher and Barnes Julia
Create a Home Valuation Report for This Property
The Home Valuation Report is an in-depth analysis detailing your home's value as well as a comparison with similar homes in the area
Home Values in the Area
Average Home Value in this Area
Purchase History
We collect this data history from publicly available records. To have your information removed, we recommend requesting removal directly through your county’s website.
| Date | Buyer | Sale Price | Title Company |
|---|---|---|---|
| Ricca Stephen | $134,000 | -- | |
| Barnes Christopher | $122,000 | -- |
Source: Public Records
Mortgage History
We collect this data history from publicly available records. To have your information removed, we recommend requesting removal directly through your county’s website.
| Date | Status | Borrower | Loan Amount |
|---|---|---|---|
| Open | Ricca Stephen | $85,000 |
Source: Public Records
Tax History
| Year | Tax Paid | Tax Assessment Tax Assessment Total Assessment is a certain percentage of the fair market value that is determined by local assessors to be the total taxable value of land and additions on the property. | Land | Improvement |
|---|---|---|---|---|
| 2025 | $7,302 | $772,100 | $613,000 | $159,100 |
| 2024 | $7,105 | $653,700 | $497,500 | $156,200 |
| 2023 | $7,105 | $620,000 | $467,500 | $152,500 |
| 2022 | $7,048 | $564,700 | $389,000 | $175,700 |
| 2021 | $7,048 | $487,100 | $330,800 | $156,300 |
| 2020 | $6,327 | $443,700 | $261,300 | $182,400 |
| 2019 | $6,038 | $413,000 | $232,800 | $180,200 |
| 2018 | $6,021 | $386,700 | $213,800 | $172,900 |
| 2017 | $6,011 | $354,200 | $213,800 | $140,400 |
| 2016 | $5,851 | $331,700 | $194,800 | $136,900 |
| 2015 | $6,130 | $335,900 | $196,300 | $139,600 |
| 2014 | $6,302 | $370,700 | $206,300 | $164,400 |
Source: Public Records
Map
Nearby Homes
- 724 19th Ave
- 1903 Margerum Ave
- 1900 Main St
- 1747 Brand Pkwy
- 1808 Pine Terrace Unit 2
- 520 18th Ave
- 1831 Laurel Terrace
- 1826 Laurel Terrace
- 1017 18th Ave
- 1615 State Route 71
- 915 Woodland Ave
- 327 South Blvd
- 217 Pitney Ave
- 517 14th Ave
- 323 16th Ave
- 1602 L St
- 1688 K St
- 823 13th Ave
- 1909 Cottage Place
- 827 13th Ave
Your Personal Tour Guide
Ask me questions while you tour the home.