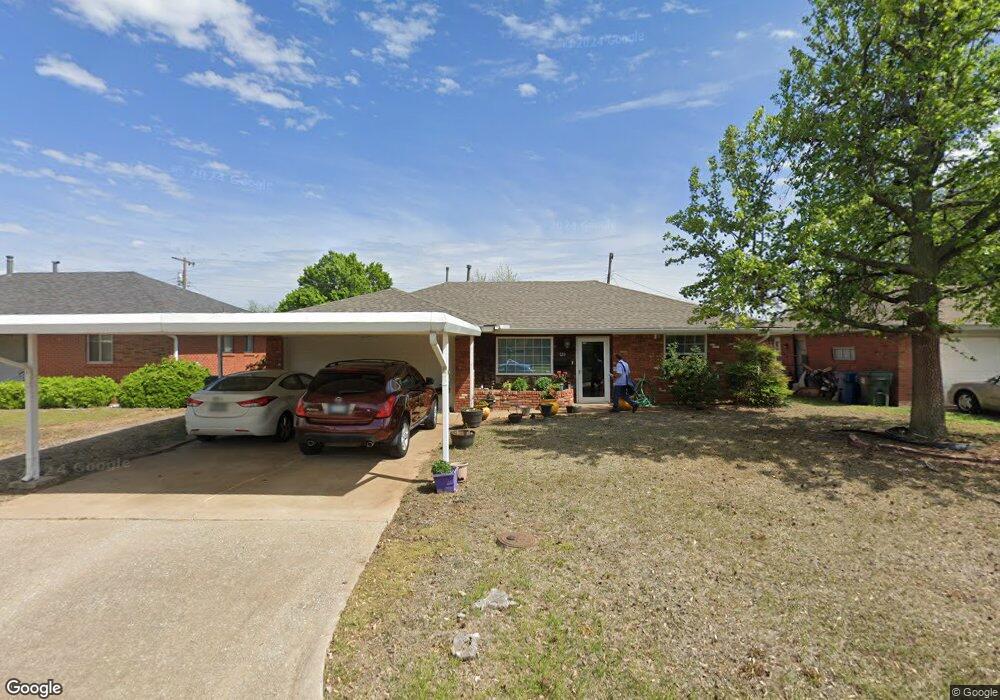
720 E Bouse Dr Oklahoma City, OK 73110
Estimated Value: $160,563 - $181,000
3
Beds
2
Baths
1,587
Sq Ft
$109/Sq Ft
Est. Value
About This Home
This home is located at 720 E Bouse Dr, Oklahoma City, OK 73110 and is currently estimated at $173,141, approximately $109 per square foot. 720 E Bouse Dr is a home located in Oklahoma County with nearby schools including Midwest City Elementary School, Midwest City Middle School, and Midwest City High School.
Ownership History
Date
Name
Owned For
Owner Type
Purchase Details
Closed on
Nov 14, 2008
Sold by
Weber Living Trust
Bought by
Lee Ginger R
Current Estimated Value
Home Financials for this Owner
Home Financials are based on the most recent Mortgage that was taken out on this home.
Original Mortgage
$104,619
Outstanding Balance
$68,949
Interest Rate
6.5%
Mortgage Type
FHA
Estimated Equity
$104,192
Purchase Details
Closed on
Nov 8, 2000
Sold by
Weber Dan E and Weber Juanita
Bought by
Weber Dan E and Weber Juanita
Create a Home Valuation Report for This Property
The Home Valuation Report is an in-depth analysis detailing your home's value as well as a comparison with similar homes in the area
Home Values in the Area
Average Home Value in this Area
Purchase History
| Date | Buyer | Sale Price | Title Company |
|---|---|---|---|
| Lee Ginger R | $106,000 | Lawyers Title Of Ok City Inc | |
| Weber Dan E | -- | -- |
Source: Public Records
Mortgage History
| Date | Status | Borrower | Loan Amount |
|---|---|---|---|
| Open | Lee Ginger R | $104,619 |
Source: Public Records
Tax History
| Year | Tax Paid | Tax Assessment Tax Assessment Total Assessment is a certain percentage of the fair market value that is determined by local assessors to be the total taxable value of land and additions on the property. | Land | Improvement |
|---|---|---|---|---|
| 2025 | $1,232 | $11,055 | $1,513 | $9,542 |
| 2024 | $1,184 | $11,055 | $1,591 | $9,464 |
| 2023 | $1,184 | $11,055 | $1,413 | $9,642 |
| 2022 | $1,173 | $11,055 | $1,535 | $9,520 |
| 2021 | $1,201 | $11,055 | $1,747 | $9,308 |
| 2020 | $1,234 | $11,055 | $1,947 | $9,108 |
| 2019 | $1,194 | $11,165 | $1,529 | $9,636 |
| 2018 | $1,120 | $11,165 | $0 | $0 |
| 2017 | $1,130 | $11,097 | $1,618 | $9,479 |
| 2016 | $1,125 | $10,775 | $1,587 | $9,188 |
| 2015 | $1,133 | $10,460 | $1,686 | $8,774 |
| 2014 | $1,096 | $10,156 | $1,725 | $8,431 |
Source: Public Records
Map
Nearby Homes
- 716 E Bouse Dr
- 724 E Bouse Dr
- 725 E Frolich Dr
- 712 E Bouse Dr
- 728 E Bouse Dr
- 721 E Frolich Dr
- 729 E Frolich Dr
- 717 E Frolich Dr
- 717 E Bouse Dr
- 721 E Bouse Dr
- 733 E Frolich Dr
- 713 E Bouse Dr
- 708 E Bouse Dr
- 732 E Bouse Dr
- 725 E Bouse Dr
- 713 E Frolich Dr
- 709 E Bouse Dr
- 729 E Bouse Dr
- 735 E Frolich Dr
- 736 E Bouse Dr
Your Personal Tour Guide
Ask me questions while you tour the home.